analysis of a pilot-scale anaerobic baffled reactor treating domestic ...
analysis of a pilot-scale anaerobic baffled reactor treating domestic ...
analysis of a pilot-scale anaerobic baffled reactor treating domestic ...

Create successful ePaper yourself
Turn your PDF publications into a flip-book with our unique Google optimized e-Paper software.
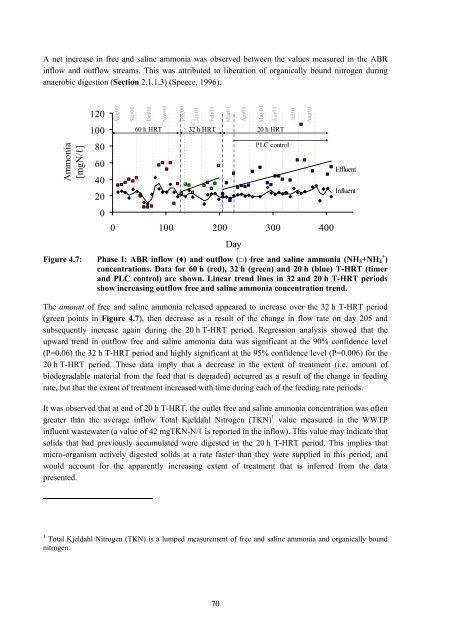
A net increase in free and saline ammonia was observed between the values measured in the ABR<br />
inflow and outflow streams. This was attributed to liberation <strong>of</strong> organically bound nitrogen during<br />
<strong>anaerobic</strong> digestion (Section 2.1.1.3) (Speece, 1996).<br />
Ammonia<br />
[mgN/ℓ]<br />
120<br />
100<br />
80<br />
60<br />
40<br />
20<br />
0<br />
Aug00<br />
Sep00<br />
Oct00<br />
Nov00<br />
Dec00<br />
Jan01<br />
Feb01<br />
0 100 200 300 400<br />
Figure 4.7: Phase I: ABR inflow (♦) and outflow (□) free and saline ammonia (NH3+NH4 + )<br />
concentrations. Data for 60 h (red), 32 h (green) and 20 h (blue) T-HRT (timer<br />
and PLC control) are shown. Linear trend lines in 32 and 20 h T-HRT periods<br />
show increasing outflow free and saline ammonia concentration trend.<br />
The amount <strong>of</strong> free and saline ammonia released appeared to increase over the 32 h T-HRT period<br />
(green points in Figure 4.7), then decrease as a result <strong>of</strong> the change in flow rate on day 205 and<br />
subsequently increase again during the 20 h T-HRT period. Regression <strong>analysis</strong> showed that the<br />
upward trend in outflow free and saline ammonia data was significant at the 90% confidence level<br />
(P=0.06) the 32 h T-HRT period and highly significant at the 95% confidence level (P=0.006) for the<br />
20 h T-HRT period. These data imply that a decrease in the extent <strong>of</strong> treatment (i.e. amount <strong>of</strong><br />
biodegradable material from the feed that is degraded) occurred as a result <strong>of</strong> the change in feeding<br />
rate, but that the extent <strong>of</strong> treatment increased with time during each <strong>of</strong> the feeding rate periods.<br />
It was observed that at end <strong>of</strong> 20 h T-HRT, the outlet free and saline ammonia concentration was <strong>of</strong>ten<br />
greater than the average inflow Total Kjeldahl Nitrogen (TKN) 1 value measured in the WWTP<br />
influent wastewater (a value <strong>of</strong> 42 mgTKN-N/ℓ is reported in the inflow). This value may indicate that<br />
solids that had previously accumulated were digested in the 20 h T-HRT period. This implies that<br />
micro-organism actively digested solids at a rate faster than they were supplied in this period, and<br />
would account for the apparently increasing extent <strong>of</strong> treatment that is inferred from the data<br />
presented.<br />
1<br />
Total Kjeldahl Nitrogen (TKN) is a lumped measurement <strong>of</strong> free and saline ammonia and organically bound<br />
nitrogen.<br />
70<br />
Mar01<br />
Day<br />
Apr01<br />
May01<br />
Jun01<br />
60 h HRT 32 h HRT 20 h HRT<br />
PLC control<br />
Jul01<br />
Aug01<br />
Effluent<br />
Influent<br />
0.5