analysis of a pilot-scale anaerobic baffled reactor treating domestic ...
analysis of a pilot-scale anaerobic baffled reactor treating domestic ...
analysis of a pilot-scale anaerobic baffled reactor treating domestic ...

Create successful ePaper yourself
Turn your PDF publications into a flip-book with our unique Google optimized e-Paper software.
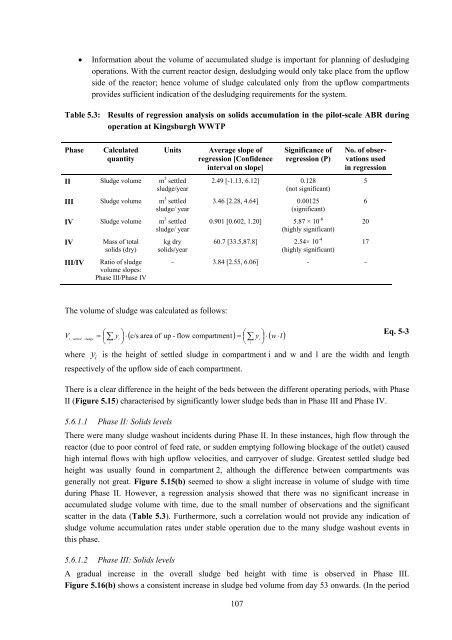
• Information about the volume <strong>of</strong> accumulated sludge is important for planning <strong>of</strong> desludging<br />
operations. With the current <strong>reactor</strong> design, desludging would only take place from the upflow<br />
side <strong>of</strong> the <strong>reactor</strong>; hence volume <strong>of</strong> sludge calculated only from the upflow compartments<br />
provides sufficient indication <strong>of</strong> the desludging requirements for the system.<br />
Table 5.3: Results <strong>of</strong> regression <strong>analysis</strong> on solids accumulation in the <strong>pilot</strong>-<strong>scale</strong> ABR during<br />
operation at Kingsburgh WWTP<br />
Phase Calculated<br />
quantity<br />
II Sludge volume m 3 settled<br />
sludge/year<br />
III Sludge volume m 3 settled<br />
sludge/ year<br />
IV Sludge volume m 3 settled<br />
sludge/ year<br />
IV<br />
III/IV<br />
Mass <strong>of</strong> total<br />
solids (dry)<br />
Ratio <strong>of</strong> sludge<br />
volume slopes:<br />
Phase III/Phase IV<br />
Units Average slope <strong>of</strong><br />
regression [Confidence<br />
interval on slope]<br />
kg dry<br />
solids/year<br />
The volume <strong>of</strong> sludge was calculated as follows:<br />
107<br />
Significance <strong>of</strong><br />
regression (P)<br />
2.49 [-1.13, 6.12] 0.128<br />
(not significant)<br />
3.46 [2.28, 4.64] 0.00125<br />
(significant)<br />
0.901 [0.602, 1.20] 5.87 × 10 -6<br />
(highly significant)<br />
60.7 [33.5,87.8] 2.54× 10 -4<br />
(highly significant)<br />
No. <strong>of</strong> observations<br />
used<br />
in regression<br />
- 3.84 [2.55, 6.06] - -<br />
Vt<br />
,<br />
settled sludge =<br />
⎛<br />
y<br />
⎞ ( ) ⎛<br />
y<br />
⎞<br />
⎜∑<br />
( w l)<br />
i ⎟ ⋅ c/s area <strong>of</strong> up - flow compartment<br />
= ⎜∑<br />
i ⎟ ⋅ ⋅<br />
⎝ i ⎠<br />
⎝ i ⎠<br />
Eq. 5-3<br />
where y i is the height <strong>of</strong> settled sludge in compartment i and w and l are the width and length<br />
respectively <strong>of</strong> the upflow side <strong>of</strong> each compartment.<br />
There is a clear difference in the height <strong>of</strong> the beds between the different operating periods, with Phase<br />
II (Figure 5.15) characterised by significantly lower sludge beds than in Phase III and Phase IV.<br />
5.6.1.1 Phase II: Solids levels<br />
There were many sludge washout incidents during Phase II. In these instances, high flow through the<br />
<strong>reactor</strong> (due to poor control <strong>of</strong> feed rate, or sudden emptying following blockage <strong>of</strong> the outlet) caused<br />
high internal flows with high upflow velocities, and carryover <strong>of</strong> sludge. Greatest settled sludge bed<br />
height was usually found in compartment 2, although the difference between compartments was<br />
generally not great. Figure 5.15(b) seemed to show a slight increase in volume <strong>of</strong> sludge with time<br />
during Phase II. However, a regression <strong>analysis</strong> showed that there was no significant increase in<br />
accumulated sludge volume with time, due to the small number <strong>of</strong> observations and the significant<br />
scatter in the data (Table 5.3). Furthermore, such a correlation would not provide any indication <strong>of</strong><br />
sludge volume accumulation rates under stable operation due to the many sludge washout events in<br />
this phase.<br />
5.6.1.2 Phase III: Solids levels<br />
A gradual increase in the overall sludge bed height with time is observed in Phase III.<br />
Figure 5.16(b) shows a consistent increase in sludge bed volume from day 53 onwards. (In the period<br />
5<br />
6<br />
20<br />
17