- Page 1:
ANALYSIS OF A PILOT-SCALE ANAEROBIC
- Page 5:
i DECLARATIONS I, Katherine Maria F
- Page 8 and 9:
My deepest thanks must be extended
- Page 11 and 12:
vii TABLE OF CONTENTS ANALYSIS OF A
- Page 13 and 14:
5.3 Feed characteristics and loadin
- Page 15 and 16:
xi LIST OF TABLES Table 1.1: List o
- Page 17 and 18:
xiii LIST OF FIGURES Figure 1.1: Gr
- Page 19 and 20:
Figure 5.1 Installation of the ABR
- Page 21 and 22:
Figure 6.8: WEST® representation o
- Page 23 and 24:
xix LIST OF ABBREVIATIONS A-HRT App
- Page 25 and 26:
1 1 INTRODUCTION The work presented
- Page 27 and 28:
obtained from anaerobic systems rel
- Page 29 and 30:
• Lalbahadur (MTech, 2005) perfor
- Page 31 and 32:
1.7 ORGANISATION OF THE THESIS This
- Page 33 and 34:
9 2 LITERATURE REVIEW A detailed re
- Page 35 and 36:
• Disintegration of composite par
- Page 37 and 38:
Homoacetogens are one of the most v
- Page 39 and 40:
Most of the control in anaerobic di
- Page 41 and 42:
therefore the sensitivity of the ov
- Page 43 and 44:
∆Gº (W) [kcal] -10 -8 -6 -4 -2 L
- Page 45 and 46:
For systems with low potential for
- Page 47 and 48:
design of the digester in which the
- Page 49 and 50:
2.2.2 Expanded granular sludge bed
- Page 51 and 52:
fact that for most non-ideal flow s
- Page 53 and 54:
hydrolysis steps to convert them to
- Page 55 and 56:
from the clarified zone between the
- Page 57 and 58:
Table 2.4: Typical pathogen surviva
- Page 59:
Table 2.5: Studies using anaerobic
- Page 62 and 63:
• There is no requirement for bio
- Page 64 and 65:
Kennedy and Barriault (2005) perfor
- Page 66 and 67:
methanogenic (Akunna and Clark, 200
- Page 68 and 69:
and 6 h with no significant differe
- Page 70 and 71:
2.5.1.12 Granule formation in ABRs
- Page 72 and 73:
• A baffled reactor is described
- Page 74 and 75:
2.5.3.4 Scanning electron microscop
- Page 76 and 77:
spacing on flow patterns in a singl
- Page 78 and 79:
Figure 3.5: Orthographic projection
- Page 80 and 81:
PLC calculated the fraction of that
- Page 82 and 83:
epresent buulk conditionns. Compart
- Page 85 and 86:
The rreactor was initially commmiss
- Page 87 and 88:
Phase I Phase II Phase III Phase IV
- Page 89 and 90:
Table 4.1: Characteristics of degri
- Page 91 and 92:
Table 4.2: Pilot-scale ABR approxim
- Page 93 and 94:
COD [mgCOD/ℓ] 2000 1800 1600 1400
- Page 95 and 96:
4.3.5 Phosphorus Figure 4.8 present
- Page 97 and 98:
Observation of sludge in compartmen
- Page 99 and 100:
Another interesting observation is
- Page 101 and 102:
4.4.3 pH pH measurements were perfo
- Page 103 and 104:
esult in low pH values. The reasons
- Page 105 and 106:
4.5 SUMMARY: PHASE I - OPERATION AT
- Page 107 and 108:
than the optimal range for methanog
- Page 109 and 110:
5 EXPERIMENTAL PHASES II-IV: KINGSB
- Page 111 and 112:
sludge on a number of occasions. Wh
- Page 113 and 114:
On days 99 and 100 of Phase III, a
- Page 115 and 116:
5.3.2 Analysis of variations in fee
- Page 117 and 118:
Table 5.2: Pilot-scale ABR average
- Page 119 and 120:
5.4.1.2 Phase III In Phase III, (Fi
- Page 121 and 122:
Phase II: Alkalinity [mgCaCO3/ℓ]
- Page 123 and 124:
Eq. 5-1 However, at a COD/SO4 2- ra
- Page 125 and 126:
wastewater was probably higher than
- Page 127 and 128:
5.5.2.2 Damping Figure 5.12 and Fig
- Page 129 and 130:
• The outflow COD values were not
- Page 131 and 132:
• Information about the volume of
- Page 133 and 134:
As with the total volume of sludge
- Page 135 and 136:
It is not clear why the rate of acc
- Page 137 and 138:
most compartments was exactly 6.5,
- Page 139 and 140:
Soluble COD [mg/ℓ] 600 500 400 30
- Page 141 and 142:
pathogens and parasites, which may
- Page 143 and 144:
% Probe of DAPI % Probe of DAPI % P
- Page 145 and 146:
later compartments at all. Furtherm
- Page 147 and 148:
and 4, with decreasing observations
- Page 149 and 150:
• The mechanism of sludge build-u
- Page 151:
Table 5.6: Inflow and outflow chara
- Page 154 and 155:
Behling et al. (1997) studied the p
- Page 156 and 157:
organisms in previous compartments.
- Page 158 and 159:
velocities. Unfortunately, these tw
- Page 160 and 161:
Thus for a fixed sludge load, at hi
- Page 162 and 163:
sampling was not possible since in
- Page 164 and 165:
Wentzel (2006) recommends a COD to
- Page 166 and 167:
6.2.1.4 Calculation of CH4 producti
- Page 168 and 169:
organically bound N) or that N accu
- Page 170 and 171: All VFA is consumed in the process,
- Page 172 and 173: However, these assumptions are clea
- Page 174 and 175: The calculated pH value is compared
- Page 176 and 177: influent alkalinity will increase d
- Page 178 and 179: The original objective to develop a
- Page 180 and 181: • It was not possible to simulate
- Page 182 and 183: employed for a medium strength wast
- Page 184 and 185: 6.6.4 Alternative baffle design Thi
- Page 186 and 187: 6.7.3 Monitoring requirements The m
- Page 188 and 189: compartments (Section 6.1.1) pH val
- Page 190 and 191: generally about anaerobic digestion
- Page 192 and 193: 7.1.1.6 Effect of sludge age on bio
- Page 194 and 195: 7.1.2.4 Critical design parameters
- Page 196 and 197: 172
- Page 198 and 199: Batstone D. J., Keller J., Angelida
- Page 200 and 201: Gopala K. G. V. T. (2007). Treatmen
- Page 202 and 203: MacLeod F. A., Guiot S. R. and Cost
- Page 204 and 205: Sasse L. (1998). Decentralised wast
- Page 206 and 207: Wanasen (2003). Upgrading conventio
- Page 209 and 210: METTHODS OFF SAMPLINNG AND ANNALYSI
- Page 211 and 212: 3.6 Enumeration of total coliforms
- Page 213 and 214: that the means are the same, or con
- Page 215 and 216: And the significance of the regress
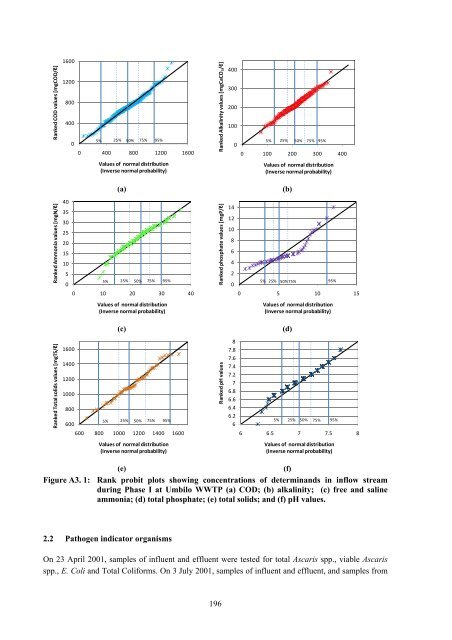
- Page 217 and 218: ADDITIONAL RESULTS 193 APPENDIX A3
- Page 219: Table A3. 1 cont. Phase I Phase II
- Page 223 and 224: 3.2 Pathogen indicator organisms A
- Page 225 and 226: APPLIED VS. APPARENT HYDRAULIC RETE
- Page 227 and 228: 19 h apparent HRT 14 h apparent HRT
- Page 229 and 230: 205 APPENDIX A5 CALCULATION OF SOLI
- Page 231 and 232: i.e. the average SRT of an accumula
- Page 233: X X = P Inert ⋅ where Xinert is t
- Page 236 and 237: iodegradable organic material may b
- Page 238 and 239: Substituting Eq. A6- 1 in Eq. A6- 7
- Page 240 and 241: 1.5 Implementation of steady-state
- Page 242 and 243: X = 7⋅ Y = 7 Z = 7⋅ A = 7⋅ (
- Page 244 and 245: Dama, P., Bell J., Naidoo, V., Foxo
- Page 246: Lalbahadur T. (2004) Characterisati