

A systematic review and economic model of the effectiveness and ...
A systematic review and economic model of the effectiveness and ...
A systematic review and economic model of the effectiveness and ...

Create successful ePaper yourself
Turn your PDF publications into a flip-book with our unique Google optimized e-Paper software.
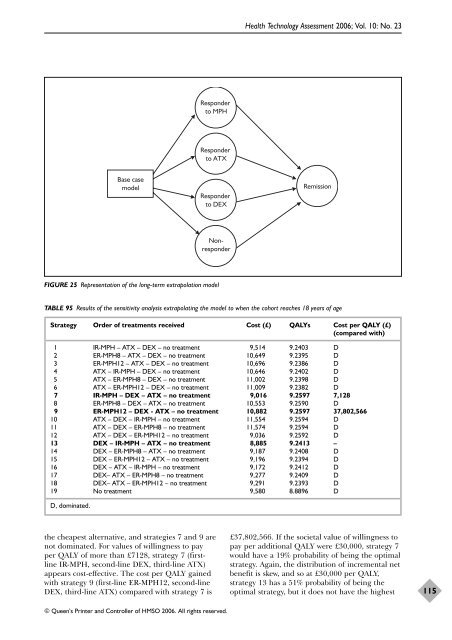
Base case<br />
<strong>model</strong><br />
Responder<br />
to MPH<br />
Responder<br />
to ATX<br />
Responder<br />
to DEX<br />
Nonresponder<br />
FIGURE 25 Representation <strong>of</strong> <strong>the</strong> long-term extrapolation <strong>model</strong><br />
<strong>the</strong> cheapest alternative, <strong>and</strong> strategies 7 <strong>and</strong> 9 are<br />
not dominated. For values <strong>of</strong> willingness to pay<br />
per QALY <strong>of</strong> more than £7128, strategy 7 (firstline<br />
IR-MPH, second-line DEX, third-line ATX)<br />
appears cost-effective. The cost per QALY gained<br />
with strategy 9 (first-line ER-MPH12, second-line<br />
DEX, third-line ATX) compared with strategy 7 is<br />
© Queen’s Printer <strong>and</strong> Controller <strong>of</strong> HMSO 2006. All rights reserved.<br />
Health Technology Assessment 2006; Vol. 10: No. 23<br />
Remission<br />
TABLE 95 Results <strong>of</strong> <strong>the</strong> sensitivity analysis extrapolating <strong>the</strong> <strong>model</strong> to when <strong>the</strong> cohort reaches 18 years <strong>of</strong> age<br />
Strategy Order <strong>of</strong> treatments received Cost (£) QALYs Cost per QALY (£)<br />
(compared with)<br />
1 IR-MPH – ATX – DEX – no treatment 9,514 9.2403 D<br />
2 ER-MPH8 – ATX – DEX – no treatment 10,649 9.2395 D<br />
3 ER-MPH12 – ATX – DEX – no treatment 10,696 9.2386 D<br />
4 ATX – IR-MPH – DEX – no treatment 10,646 9.2402 D<br />
5 ATX – ER-MPH8 – DEX – no treatment 11,002 9.2398 D<br />
6 ATX – ER-MPH12 – DEX – no treatment 11,009 9.2382 D<br />
7 IR-MPH – DEX – ATX – no treatment 9,016 9.2597 7,128<br />
8 ER-MPH8 – DEX – ATX – no treatment 10,553 9.2590 D<br />
9 ER-MPH12 – DEX - ATX – no treatment 10,882 9.2597 37,802,566<br />
10 ATX – DEX – IR-MPH – no treatment 11,554 9.2594 D<br />
11 ATX – DEX – ER-MPH8 – no treatment 11,574 9.2594 D<br />
12 ATX – DEX – ER-MPH12 – no treatment 9,036 9.2592 D<br />
13 DEX – IR-MPH – ATX – no treatment 8,885 9.2413 –<br />
14 DEX – ER-MPH8 – ATX – no treatment 9,187 9.2408 D<br />
15 DEX – ER-MPH12 – ATX – no treatment 9,196 9.2394 D<br />
16 DEX – ATX – IR-MPH – no treatment 9,172 9.2412 D<br />
17 DEX– ATX – ER-MPH8 – no treatment 9,277 9.2409 D<br />
18 DEX– ATX – ER-MPH12 – no treatment 9,291 9.2393 D<br />
19 No treatment 9,580 8.8896 D<br />
D, dominated.<br />
£37,802,566. If <strong>the</strong> societal value <strong>of</strong> willingness to<br />
pay per additional QALY were £30,000, strategy 7<br />
would have a 19% probability <strong>of</strong> being <strong>the</strong> optimal<br />
strategy. Again, <strong>the</strong> distribution <strong>of</strong> incremental net<br />
benefit is skew, <strong>and</strong> so at £30,000 per QALY,<br />
strategy 13 has a 51% probability <strong>of</strong> being <strong>the</strong><br />
optimal strategy, but it does not have <strong>the</strong> highest<br />
115


