

A systematic review and economic model of the effectiveness and ...
A systematic review and economic model of the effectiveness and ...
A systematic review and economic model of the effectiveness and ...

Create successful ePaper yourself
Turn your PDF publications into a flip-book with our unique Google optimized e-Paper software.
44 TABLE 20<br />
Clinical <strong>effectiveness</strong><br />
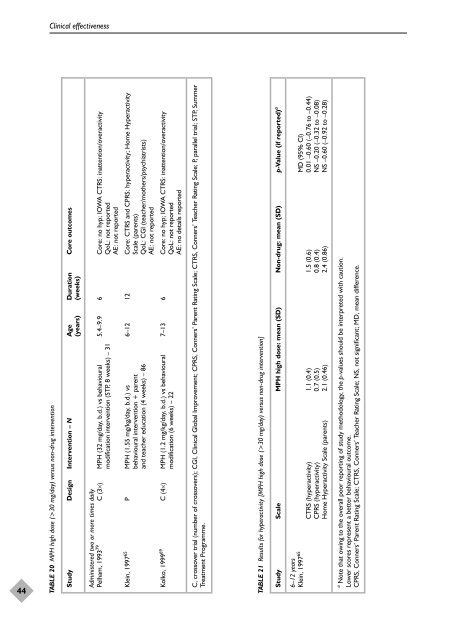
MPH high dose (>30 mg/day) versus non-drug intervention<br />
Study Design Intervention – N Age Duration Core outcomes<br />
(years) (weeks)<br />
Administered two or more times daily<br />
Pelham, 1993 79 C (3×) MPH (32 mg/day, b.d.) vs behavioural 5.4–9.9 6 Core: no hyp; IOWA CTRS: inattention/overactivity<br />
modification intervention (STP, 8 weeks) – 31 QoL: not reported<br />
AE: not reported<br />
Klein, 1997 65 P MPH (1.55 mg/kg/day, b.d.) vs 6–12 12 Core: CTRS <strong>and</strong> CPRS: hyperactivity; Home Hyperactivity<br />
behavioural intervention + parent Scale (parents)<br />
<strong>and</strong> teacher education (4 weeks) – 86 QoL: CGI (teacher/mo<strong>the</strong>rs/psychiatrists)<br />
AE: not reported<br />
Kolko, 1999 69 C (4×) MPH (1.2 mg/kg/day, b.d.) vs behavioural 7–13 6 Core: no hyp; IOWA CTRS: inattention/overactivity<br />
modification (6 weeks) – 22 QoL: not reported<br />
AE: no details reported<br />
C, crossover trial (number <strong>of</strong> crossovers); CGI, Clinical Global Improvement; CPRS, Conners’ Parent Rating Scale; CTRS, Conners’ Teacher Rating Scale; P, parallel trial; STP, Summer<br />
Treatment Programme.<br />
TABLE 21 Results for hyperactivity [MPH high dose (>30 mg/day) versus non-drug intervention]<br />
Study Scale MPH high dose: mean (SD) Non-drug: mean (SD) p-Value (if reported) a<br />
6–12 years<br />
Klein, 1997 65 MD (95% CI)<br />
CTRS (hyperactivity) 1.1 (0.4) 1.5 (0.6) 0.01 –0.60 (–0.76 to –0.44)<br />
CPRS (hyperactivity) 0.7 (0.5) 0.8 (0.4) NS –0.20 (–0.32 to –0.08)<br />
Home Hyperactivity Scale (parents) 2.1 (0.46) 2.4 (0.86) NS –0.60 (–0.92 to –0.28)<br />
a Note that owing to <strong>the</strong> overall poor reporting <strong>of</strong> study methodology, <strong>the</strong> p-values should be interpreted with caution.<br />
Lower scores represent a better behavioural outcome.<br />
CPRS, Conners’ Parent Rating Scale; CTRS, Conners’ Teacher Rating Scale; NS, not significant; MD, mean difference.


