Annual Report 2006-2007 - Gammon India
Annual Report 2006-2007 - Gammon India
Annual Report 2006-2007 - Gammon India

You also want an ePaper? Increase the reach of your titles
YUMPU automatically turns print PDFs into web optimized ePapers that Google loves.
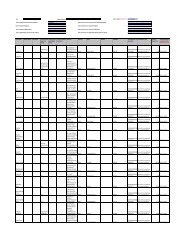
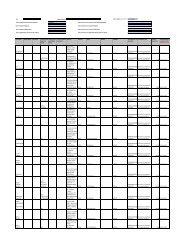
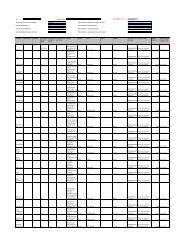
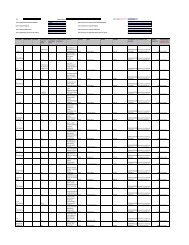
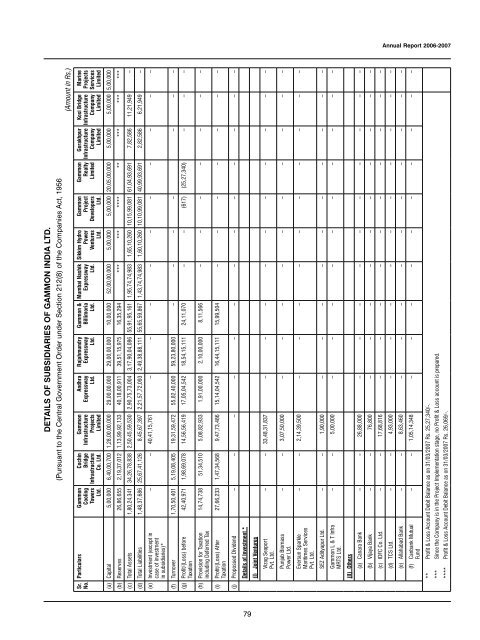
DETAILS OF SUBSIDIARIES OF GAMMON INDIA LTD.<br />
(Pursuant to the Central Government Order under Section 212(8) of the Companies Act, 1956<br />
(Amount in Rs.)<br />
Marine<br />
Projects<br />
Services<br />
Limited<br />
Kosi Bridge<br />
Infrastructure<br />
Company<br />
Limited<br />
Gorakhpur<br />
Infrastructure<br />
Company<br />
Limited<br />
<strong>Gammon</strong><br />
Realty<br />
Limited<br />
<strong>Gammon</strong><br />
Project<br />
Developers<br />
Ltd.<br />
Sikkim Hydro<br />
Power<br />
Ventures<br />
Ltd.<br />
Mumbai Nashik<br />
Expressway<br />
Ltd.<br />
<strong>Gammon</strong> &<br />
Billimoria<br />
Ltd.<br />
Rajahmundry<br />
Expressway<br />
Ltd.<br />
Andhra<br />
Expressway<br />
Ltd.<br />
<strong>Gammon</strong><br />
Infrastructure<br />
Projects<br />
Limited<br />
Cochin<br />
Bridge<br />
Infrastructure<br />
Co. Ltd.<br />
Particulars <strong>Gammon</strong><br />
Cooling<br />
Towers<br />
Ltd.<br />
Sr.<br />
No.<br />
(a) Capital 5,00,000 6,40,00,700 1,28,00,00,000 29,00,00,000 29,00,00,000 10,00,000 52,00,00,000 5,00,000 5,00,000 20,05,00,000 5,00,000 5,00,000 5,00,000<br />
(b) Reserves 26,86,655 2,19,37,012 1,13,99,92,133 40,18,00,911 39,51,15,975 16,35,294 *** *** **** ** *** *** ***<br />
(c) Total Assets 1,80,24,341 34,26,78,838 2,50,45,59,530 2,90,75,73,004 3,17,90,04,086 55,91,95,161 1,95,74,74,983 1,65,10,260 10,15,99,081 61,04,93,691 7,82,586 11,21,949 –<br />
(d) Total Liabilities 1,48,37,686 25,67,41,126 8,45,67,397 2,21,57,72,093 2,49,38,88,111 55,65,59,867 1,43,74,74,983 1,60,10,260 10,10,99,081 40,99,93,691 2,82,586 6,21,949 –<br />
(e) Investment (except in<br />
– – 40,41,15,761 – – – – – – – – – –<br />
case of investment<br />
in subsidiaries)*<br />
(f) Turnover 1,70,50,401 5,19,08,405 19,31,59,472 55,82,40,000 59,23,80,000 – – – – – – –<br />
42,40,971 1,98,69,078 14,56,56,419 17,05,04,542 18,54,15,111 24,11,070 – – (617) (25,27,340) – – –<br />
(g) Profit/(Loss) before<br />
Taxation<br />
14,74,738 51,34,510 5,08,82,933 1,91,00,000 2,10,00,000 8,11,566 – – – – – – –<br />
(h) Provision for Taxation<br />
including Deferred Tax<br />
27,66,233 1,47,34,568 9,47,73,486 15,14,04,542 16,44,15,111 15,99,504 – – – – – – –<br />
(i) Profit/(Loss) After<br />
Taxation<br />
(j) Propossed Dividend – – – – – – – – – – – – –<br />
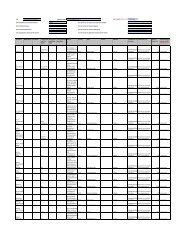
Details of Investment *<br />
79<br />
(I) Joint Ventures<br />
– – 33,48,31,837 – – – – – – – – – –<br />
Vizag Seaport<br />
Pvt. Ltd.<br />
– – 3,07,50,000 – – – – – – – – – –<br />
Punjab Biomass<br />
Power Ltd.<br />
– – 2,14,39,500 – – – – – – – – – –<br />
Eversun Sparkle<br />
Maritimes Services<br />
Pvt. Ltd.<br />
SEZ Adityapur Ltd. – – 1,90,000 – – – – – – – – – –<br />
– – 5,00,000 – – – – – – – – – –<br />
<strong>Gammon</strong> L & T Infra<br />
MRTS Ltd.<br />
(II) Others<br />
(a) Canara Bank – – 26,88,000 – – – – – – – – – –<br />
(b) Vijaya Bank – – 76,800 – – – – – – – – – –<br />
(c) IDFC Co. Ltd. – – 17,68,816 – – – – – – – – – –<br />
<strong>Annual</strong> <strong>Report</strong> <strong>2006</strong>-<strong>2007</strong><br />
(d) TCS Ltd. – – 4,93,000 – – – – – – – – – –<br />
(e) Allahabad Bank – – 8,63,460 – – – – – – – – – –<br />
(f) Canbank Mutual<br />
– – 1,05,14,348 – – – – – – – – – –<br />
Fund<br />
** Profit & Loss Account Debit Balance as on 31/03/<strong>2007</strong> Rs. 25,27,340/-.<br />
*** Since the Company is in the Project Implementation stage, no Profit & Loss account is prepared.<br />
**** Profit & Loss Account Debit Balance as on 31/03/<strong>2007</strong> Rs. 26,069/-.