novel approaches to expression and detection of oestrus in dairy cows
novel approaches to expression and detection of oestrus in dairy cows
novel approaches to expression and detection of oestrus in dairy cows
Create successful ePaper yourself
Turn your PDF publications into a flip-book with our unique Google optimized e-Paper software.
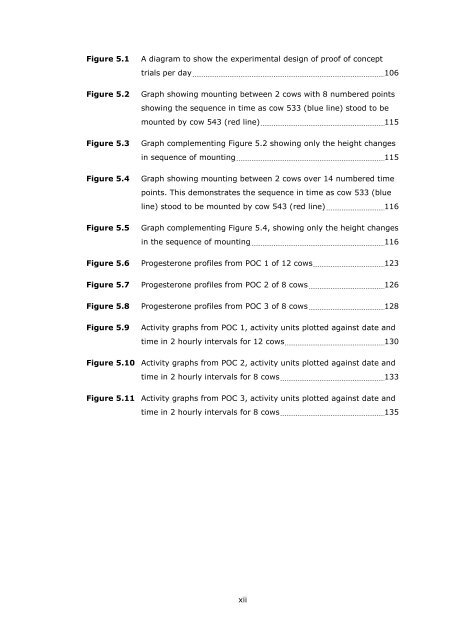
Figure 5.1<br />
Figure 5.2<br />
Figure 5.3<br />
Figure 5.4<br />
Figure 5.5<br />
A diagram <strong>to</strong> show the experimental design <strong>of</strong> pro<strong>of</strong> <strong>of</strong> concept<br />
trials per day 106<br />
Graph show<strong>in</strong>g mount<strong>in</strong>g between 2 <strong>cows</strong> with 8 numbered po<strong>in</strong>ts<br />
show<strong>in</strong>g the sequence <strong>in</strong> time as cow 533 (blue l<strong>in</strong>e) s<strong>to</strong>od <strong>to</strong> be<br />
mounted by cow 543 (red l<strong>in</strong>e) 115<br />
Graph complement<strong>in</strong>g Figure 5.2 show<strong>in</strong>g only the height changes<br />
<strong>in</strong> sequence <strong>of</strong> mount<strong>in</strong>g 115<br />
Graph show<strong>in</strong>g mount<strong>in</strong>g between 2 <strong>cows</strong> over 14 numbered time<br />
po<strong>in</strong>ts. This demonstrates the sequence <strong>in</strong> time as cow 533 (blue<br />
l<strong>in</strong>e) s<strong>to</strong>od <strong>to</strong> be mounted by cow 543 (red l<strong>in</strong>e) 116<br />
Graph complement<strong>in</strong>g Figure 5.4, show<strong>in</strong>g only the height changes<br />
<strong>in</strong> the sequence <strong>of</strong> mount<strong>in</strong>g 116<br />
Figure 5.6 Progesterone pr<strong>of</strong>iles from POC 1 <strong>of</strong> 12 <strong>cows</strong> 123<br />
Figure 5.7 Progesterone pr<strong>of</strong>iles from POC 2 <strong>of</strong> 8 <strong>cows</strong> 126<br />
Figure 5.8 Progesterone pr<strong>of</strong>iles from POC 3 <strong>of</strong> 8 <strong>cows</strong> 128<br />
Figure 5.9<br />
Activity graphs from POC 1, activity units plotted aga<strong>in</strong>st date <strong>and</strong><br />
time <strong>in</strong> 2 hourly <strong>in</strong>tervals for 12 <strong>cows</strong> 130<br />
Figure 5.10 Activity graphs from POC 2, activity units plotted aga<strong>in</strong>st date <strong>and</strong><br />
time <strong>in</strong> 2 hourly <strong>in</strong>tervals for 8 <strong>cows</strong> 133<br />
Figure 5.11 Activity graphs from POC 3, activity units plotted aga<strong>in</strong>st date <strong>and</strong><br />
time <strong>in</strong> 2 hourly <strong>in</strong>tervals for 8 <strong>cows</strong> 135<br />
xii


