- Page 2 and 3:
Pesticide residues in food — 2006
- Page 4:
TABLE OF CONTENTS Page List of part
- Page 7 and 8:
Dr Helen Hakansson, Institute of En
- Page 10 and 11:
Abbreviations used ADI ALT APDM ARf
- Page 12:
Introduction The toxicological mono
- Page 16 and 17:
BIFENAZATE First draft prepared by
- Page 18 and 19:
5 In a series of experiments, group
- Page 20 and 21:
7 In a study of the time-course of
- Page 22 and 23:
9 the administered dose in males an
- Page 24 and 25:
11 limited absorption of parent com
- Page 26 and 27:
13 NAME/No. STRUCTURE D1989 OCH 3 D
- Page 28 and 29:
15 2.1 Acute toxicity Results of st
- Page 30 and 31:
17 (f) Sensitization In a study of
- Page 32 and 33:
19 Table 9. Clinical chemistry effe
- Page 34 and 35:
21 The degree of this finding was m
- Page 36 and 37:
23 On histopathological examination
- Page 38 and 39:
25 (equal to 0, 0.9, 10.4 or 25 mg/
- Page 40 and 41:
27 Haemoglobin (g/dl): Before treat
- Page 42 and 43:
29 weekly. Blood and urine samples
- Page 44 and 45:
31 (females) (equal to 0, 1.0, 3.9,
- Page 46 and 47:
33 Cytogenetic test Chinese hamster
- Page 48 and 49:
35 groups of 30 males and 30 female
- Page 50 and 51:
37 and placed in 10% ammonium sulfi
- Page 52 and 53:
39 was > 5000 mg/kg bw. The LC 50 i
- Page 54 and 55:
41 Multigeneration study of reprodu
- Page 56 and 57:
43 Medical data No significant adve
- Page 58:
45 Trutter, J.A. (1997a) 28-Day die
- Page 61 and 62:
48 Evaluation for acceptable daily
- Page 63 and 64:
50 Table 2. Radioactivity in blood
- Page 65 and 66:
52 10 10 0.42 0.0462 0.63 0.0080 8.
- Page 67 and 68:
54 Figure 2. Transfer of radioactiv
- Page 69 and 70:
56 Skin 33.07 61.59 0.5 17.94 17.29
- Page 71 and 72:
58 Table 10. Summary of metabolites
- Page 73 and 74:
60 Table 14. Summary of identified
- Page 75 and 76:
62 Table 18. Summary of metabolites
- Page 77 and 78:
64 Table 19. Structures of identifi
- Page 79 and 80:
66 Metabolite Structure O M510F14 N
- Page 81 and 82:
68 Metabolite Structure M510F39 N O
- Page 83 and 84:
70 2. Toxicological studies 2.1 Acu
- Page 85 and 86:
72 1% Tylose CB 30.000. The injecti
- Page 87 and 88:
74 the end of dosing. Blood samples
- Page 89 and 90:
76 examinations were carried out 8
- Page 91 and 92:
78 concentrations were increased at
- Page 93 and 94:
80 times were slightly, but signifi
- Page 95 and 96:
82 in males and females rats at 250
- Page 97 and 98:
84 End-point Test object Dose a (LE
- Page 99 and 100:
86 parental rats was not markedly a
- Page 101 and 102:
88 groups in conception frequencies
- Page 103 and 104:
90 0.7 ± 3.5%, 1.8 ± 4.2%, 2.9 ±
- Page 105 and 106:
92 In this study of developmental n
- Page 107 and 108:
94 3. Observations in humans In the
- Page 109 and 110:
96 was 100 ppm, equal to 10 mg/kg b
- Page 111 and 112:
98 Acute toxicity Rat, LD 50 , oral
- Page 113 and 114:
100 Mellert, W., Kaufmann, W. & Hil
- Page 116 and 117:
CYFLUTHRIN AND BETA-CYFLUTHRIN Firs
- Page 118 and 119:
105 Table 1. Diastereoisomer pairs
- Page 120 and 121:
107 (i) In vivo Rats Four groups of
- Page 122 and 123:
109 2. Toxicological studies 2.1 Ac
- Page 124 and 125:
111 Species Strain Sex Route Formul
- Page 126 and 127:
113 Rat Groups of 20 male and 20 fe
- Page 128 and 129:
115 group and in the groups at the
- Page 130 and 131:
117 cyfluthrin (purity, 95.5-95.9%)
- Page 132 and 133:
119 In a short-term study of exposu
- Page 134 and 135:
121 and dissection. At termination,
- Page 136 and 137:
123 2.5 Reproductive toxicity (a) M
- Page 138 and 139:
125 gestation. The vehicle was 1% C
- Page 140 and 141:
127 females was exposed during days
- Page 142 and 143:
129 were not seen in rats in the co
- Page 144 and 145:
131 men was exposed for 1 h to actu
- Page 146 and 147:
133 40 g/l, in a flowable concentra
- Page 148 and 149:
135 were removed from five males an
- Page 150 and 151:
137 weights and food consumption we
- Page 152 and 153:
139 In females at the highest dose,
- Page 154 and 155:
141 The dermal toxicity of cyfluthr
- Page 156 and 157:
143 The Meeting concluded that the
- Page 158 and 159:
145 Estimate of acute reference dos
- Page 160 and 161:
147 Cage, S. (2004) [ 14 C]-beta-cy
- Page 162 and 163:
149 Heimann, K.G. (1984c) FCR 4545
- Page 164 and 165:
151 Jones, R.D. & Hastings, T.F. (1
- Page 166 and 167:
153 Pauluhn, J. & Mohr, U. (1984).
- Page 168:
155 Von Keutz, E. (1987) FCR 4545 -
- Page 171 and 172:
158 Zeta-cypermethrin .............
- Page 173 and 174:
160 Evaluation for acceptable daily
- Page 175 and 176:
162 polar metabolites, which are fu
- Page 177 and 178:
164 for up to 70 days. Signs typica
- Page 179 and 180:
166 rapidly metabolized by cleavage
- Page 181 and 182:
168 2. Toxicological studies 2.1 Ac
- Page 183 and 184:
170 Table 2. Effect of cis : trans
- Page 185 and 186:
172 Table 3. Significant haematolog
- Page 187 and 188:
174 Rabbits Occluded dermal applica
- Page 189 and 190:
176 1100 ppm in weeks 1-6, with inc
- Page 191 and 192:
178 Wistar-derived (Alderley Park)
- Page 193 and 194:
180 At 1500 ppm, liver APDM activit
- Page 195 and 196:
182 for premature deaths, 10 male a
- Page 197 and 198:
184 by gavage for days 7 to 19 of g
- Page 199 and 200:
186 observed at the intermediate an
- Page 201 and 202:
188 The females recovered from this
- Page 203 and 204:
190 tibial nerve (SPTN), trigeminal
- Page 205 and 206:
192 4. Toxicological studies 4.1 Ac
- Page 207 and 208:
194 for 5 weeks. Observations inclu
- Page 209 and 210:
196 caused obvious irritation and r
- Page 211 and 212:
198 days 6-15 of gestation. After m
- Page 213 and 214:
200 was observed in two males at 72
- Page 215 and 216:
202 control and other treated group
- Page 217 and 218:
204 Table 14. Results of studies of
- Page 219 and 220:
206 (b) Developmental toxicity Rats
- Page 221 and 222:
208 mild and temporary paraesthesia
- Page 223 and 224:
210 range appeared to exist for the
- Page 225 and 226:
212 for which the LD 50 was > 2000
- Page 227 and 228:
214 substances. Since conventional
- Page 229 and 230:
216 Critical end-points relevant fo
- Page 231 and 232:
218 Butterworth, S.T.G. & Clark, D.
- Page 233 and 234:
220 East Millstone, New Jersey, USA
- Page 235 and 236:
222 Jersey, USA. Submitted to WHO b
- Page 237 and 238:
224 Toxicology Laboratory (Tunstall
- Page 239 and 240:
226 Ullrich, B. (2003) Report on a
- Page 241 and 242:
228 Cyromazine was first evaluated
- Page 243 and 244:
230 were taken for the measurement
- Page 245 and 246:
232 highest dose, rather than indic
- Page 247 and 248:
234 Tissue residues: Tissues a < 0.
- Page 249 and 250:
236 Because of the low total recove
- Page 251 and 252:
238 Name Description Compound found
- Page 253 and 254:
240 After each dose of [U- 14 C tri
- Page 255 and 256:
242 In male and female monkeys give
- Page 257 and 258:
244 stress and discomfort during th
- Page 259 and 260:
246 Table 18. Dermal absorption of
- Page 261 and 262:
248 rate under steady-state conditi
- Page 263 and 264:
250 2. Toxicological studies 2.1 Ac
- Page 265 and 266:
252 the test substance. The method
- Page 267 and 268:
254 taken for haematological and bi
- Page 269 and 270:
256 not differ appreciably from pre
- Page 271 and 272:
258 Analysis of the diets showed th
- Page 273 and 274:
260 considered to be biologically s
- Page 275 and 276:
262 observed incidence probably rel
- Page 277 and 278:
264 c Cyromazine was assayed twice
- Page 279 and 280:
266 2.5 Reproductive toxicity (a) M
- Page 281 and 282:
268 either sporadic or as a consequ
- Page 283 and 284:
270 fetuses were removed, weighed a
- Page 285 and 286:
272 The NOAEL for maternal toxicity
- Page 287 and 288:
274 In New Zealand White rabbits, c
- Page 289 and 290:
276 and litters with malformations.
- Page 291 and 292:
278 of melamine powder into the rab
- Page 293 and 294:
280 reduction in the survival of ma
- Page 295 and 296:
282 There is significantly less ris
- Page 297 and 298:
284 Toxicological data Cyromazine h
- Page 299 and 300:
286 Toxicological evaluation The Me
- Page 301 and 302:
288 Other toxicological studies Tox
- Page 303 and 304:
290 IARC (1999a) Some chemicals tha
- Page 305 and 306:
292 Simoneaux, B. & Marco, G. (1984
- Page 307 and 308:
294 Declaration of Helsinki (Cristi
- Page 309 and 310:
296 lowered arousal level at doses
- Page 311 and 312:
298 Cerebellum 3 1 51** 76** 80** 7
- Page 313 and 314:
300 Table 4. Maximum inhibition of
- Page 315 and 316:
302 auditory/physical examination w
- Page 317 and 318:
304 • • • • • Home-cage o
- Page 319 and 320:
306 Dogs Groups of four male and fo
- Page 321 and 322:
308 capsules. Some volunteers recei
- Page 323 and 324:
310 Blood was taken for measurement
- Page 325 and 326:
312 Human a Dietary administration
- Page 327 and 328:
314 Piccirillo, V.J. (1978) Acute o
- Page 329 and 330:
316 Haloxyfop (racemic), its sodium
- Page 331 and 332:
318 Recovery of radioactivity in ur
- Page 333 and 334:
320 skin of nine male and nine fema
- Page 335 and 336:
322 1.2 Biotransformation Mice In a
- Page 337 and 338:
324 2. Toxicological studies 2.1 Ac
- Page 339 and 340:
326 96%) at a concentration designe
- Page 341 and 342:
328 was centrilobular hepatocellula
- Page 343 and 344:
330 The treatment had no effect on
- Page 345 and 346:
332 All dogs were killed for autops
- Page 347 and 348:
334 with that of controls (but no s
- Page 349 and 350:
336 Table 4. Results of studies of
- Page 351 and 352:
338 doses of up to 1.0 mg/kg bw per
- Page 353 and 354:
340 delayed ossification in the hyo
- Page 355 and 356:
342 Mice In a GLP-compliant study,
- Page 357 and 358:
344 and in females at the highest d
- Page 359 and 360:
346 Between January 1999 and Januar
- Page 361 and 362:
348 The Meeting concluded that halo
- Page 363 and 364:
350 Critical end-points for setting
- Page 365 and 366:
352 Elcombe, B.M. (2002a) Effects o
- Page 367 and 368:
354 Scortichini, B.H., Bohl, R.W. &
- Page 369 and 370:
356 Economic Co-operation and Devel
- Page 371 and 372:
358 There were no treatment-related
- Page 373 and 374:
360 comparable to control levels. A
- Page 375 and 376:
362 Groups of 17 male and 17 female
- Page 377 and 378:
364 No compound-related effects wer
- Page 379 and 380:
366 Berry, D. & Gore, C.W. (1975) P
- Page 381 and 382:
368 Quinoxyfen has not been evaluat
- Page 383 and 384:
370 In the main study, which compli
- Page 385 and 386:
372 Concentrations of total radioac
- Page 387 and 388:
374 several hydroxy-quinoxyfen meta
- Page 389 and 390:
376 There were no mortalities or ad
- Page 391 and 392:
378 at doses of ≥ 100 mg/kg bw pe
- Page 393 and 394:
380 In a GLP-compliant study to det
- Page 395 and 396:
382 control group. This was observe
- Page 397 and 398:
384 The homogeneity and stability o
- Page 399 and 400:
386 Testes weight (g) at 24 months
- Page 401 and 402:
388 slight (3 out of 30) hepatocell
- Page 403 and 404:
390 marked inanition, decreased fae
- Page 405 and 406:
392 Females Relative liver weightt
- Page 407 and 408:
394 were patch-tested specifically
- Page 409 and 410:
396 In studies of developmental tox
- Page 411 and 412:
398 Rat, LC 50 , inhalation Rabbit,
- Page 413 and 414:
400 Gollapudi, B.B. & Lick, S.J. (1
- Page 416 and 417:
TEMEPHOS First draft prepared by De
- Page 418 and 419:
405 by thin-layer chromatography (T
- Page 420 and 421:
407 In a special study to investiga
- Page 422 and 423:
409 concluded that temephos was of
- Page 424 and 425:
411 Table 3. Effects on mean erythr
- Page 426 and 427:
413 Females 0 1.091 1.224 1.324 1.3
- Page 428 and 429:
415 of up to 18 ppm. In the group a
- Page 430 and 431:
417 Chromosomal aberration DNA repa
- Page 432 and 433:
419 of the birds treated with temep
- Page 434 and 435:
421 concentration of 1 ppm. Only on
- Page 436 and 437:
423 being appreciably less than thi
- Page 438 and 439:
425 Lowest relevant developmental N
- Page 440:
427 WHO (1991) Safe use of pesticid
- Page 443 and 444: 430 All new studies with thiabendaz
- Page 445 and 446: 432 use of this dose form was consi
- Page 447 and 448: 434 At 1000 mg/kg bw, qualitative e
- Page 449 and 450: 436 At 100 mg/kg bw, slightly decre
- Page 451 and 452: 438 There were no treatment-related
- Page 453 and 454: 440 Table 6. Incidence of malformat
- Page 455 and 456: 442 Dose (mg/kg bw) (grouped by exp
- Page 457 and 458: 444 1157 12/21 (57.1)*** 27.2 ± 33
- Page 459 and 460: 446 versus placebo): increased appe
- Page 461 and 462: 448 activity, tiptoe gait, landing
- Page 463 and 464: 450 Noakes, J.P. (2005a) Thianendaz
- Page 465 and 466: 452 tests normally performed and th
- Page 467 and 468: 454 Radiolabel was excreted primari
- Page 469 and 470: 456 the excretory organs, was the r
- Page 471 and 472: 458 Table 6. Excretion of radioacti
- Page 473 and 474: 460 of unchanged parent compound we
- Page 475 and 476: 462 M10 (KNO 1891) + M11 (KNO 1893)
- Page 477 and 478: 464 on body weights. Exposure at 15
- Page 479 and 480: 466 The no-observed-adverse-effect
- Page 481 and 482: 468 Hepatocytes, hypertrophy 0 2 6
- Page 483 and 484: 470 they may also be related to var
- Page 485 and 486: 472 weights of males were approxima
- Page 487 and 488: 474 Thyroid weight (mg): Week 12 6
- Page 489 and 490: 476 Table 17. Relevant findings in
- Page 491 and 492: 478 Dogs In a dose range-finding st
- Page 493: 480 Prostate / uterine weight (g) 2
- Page 497 and 498: 484 No gross findings were observed
- Page 499 and 500: 486 received a macroscopic examinat
- Page 501 and 502: 488 Although decreased concentratio
- Page 503 and 504: 490 Sciatic nerve; No. examined 50
- Page 505 and 506: 492 are caused by the higher incide
- Page 507 and 508: 494 2.5 Reproductive toxicity (a) M
- Page 509 and 510: 496 In a two-generation study of re
- Page 511 and 512: 498 In dams that died or were sacri
- Page 513 and 514: 500 No clinical signs or increased
- Page 515 and 516: 502 Table 33. Selected variations a
- Page 517 and 518: 504 Days 16-21 73.3 78.7 62.5 44.3*
- Page 519 and 520: 506 Thiacloprid was not teratogenic
- Page 521 and 522: 508 Table 37. Motor and locomotor a
- Page 523 and 524: 510 Day 91 19.78 20.00 19.58 18.22*
- Page 525 and 526: 512 Table 40. Selected findings in
- Page 527 and 528: 514 plate incorporation procedure,
- Page 529 and 530: 516 (iv) Comparative study on liver
- Page 531 and 532: 518 and relative liver weight in an
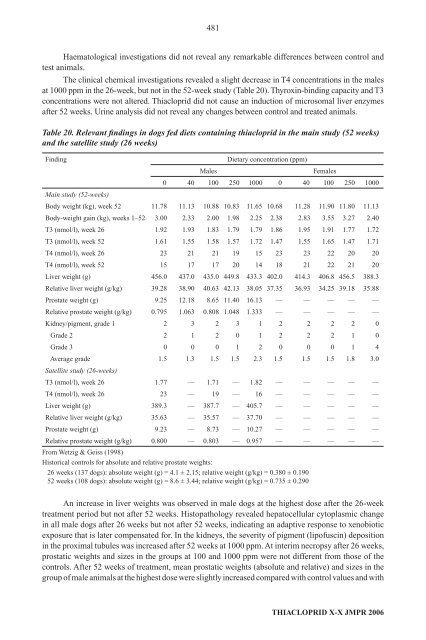
- Page 533 and 534: 520 at 2500 ppm. The administration
- Page 535 and 536: 522 No macroscopic changes were det
- Page 537 and 538: 524 The following procedures were p
- Page 539 and 540: 526 litter for the group at 1000 pp
- Page 541 and 542: 528 Hepatic enzyme activities in th
- Page 543 and 544: 530 subtypes 1A1, 2B1, 2D1 and othe
- Page 545 and 546:
532 Long-term studies of toxicity a
- Page 547 and 548:
534 The Meeting concluded that ther
- Page 549 and 550:
536 Estimate of acceptable daily in
- Page 551 and 552:
538 dated 27 July, from Bayer AG, W
- Page 553 and 554:
540 Kroetlinger, F. (1995a) YRC 289
- Page 555 and 556:
542 Wetzig, H. & Geiss, V. (1998b)
- Page 557 and 558:
544 Table A1. NOAELs and LOAELs for
- Page 559 and 560:
546 2.2 Postulated mode of action (
- Page 561 and 562:
548 • • • Chromosomal aberrat
- Page 563 and 564:
550 Table A3. NOAELs and LOAELs for
- Page 565 and 566:
552 Appendix 2 Table B1. List of an
- Page 567 and 568:
554 Metabolite Structure / trivial
- Page 569 and 570:
556 Metabolite Structure / trivial
- Page 571 and 572:
558 Evaluation for acute reference
- Page 573 and 574:
560 increased thyroid weights in th
- Page 575 and 576:
562 Table 4. Results of bone-marrow
- Page 577 and 578:
564 malformations between the contr
- Page 579 and 580:
566 In a study of prenatal developm
- Page 581 and 582:
568 combination of heparin and an a
- Page 583 and 584:
570 Table 10. Selected findings fro
- Page 585 and 586:
572 In a short-term study of neurot
- Page 588 and 589:
ANNEX 1 Reports and other documents
- Page 590 and 591:
577 31. Pesticide residues in food:
- Page 592 and 593:
579 66. Pesticide residues in food
- Page 594:
581 100. Pesticide residues in food