Moving forward in Zimbabwe - Brooks World Poverty Institute - The ...
Moving forward in Zimbabwe - Brooks World Poverty Institute - The ...
Moving forward in Zimbabwe - Brooks World Poverty Institute - The ...

Create successful ePaper yourself
Turn your PDF publications into a flip-book with our unique Google optimized e-Paper software.
<strong>Mov<strong>in</strong>g</strong> <strong>forward</strong> <strong>in</strong> <strong>Zimbabwe</strong><br />
Reduc<strong>in</strong>g poverty and promot<strong>in</strong>g growth<br />
alongside a loosely regulated non-formal sector (consist<strong>in</strong>g of the<br />
communal subsistence sector and the <strong>in</strong>formal sector). We shall<br />
return to the implications of this <strong>in</strong> our discussion of labour<br />
markets <strong>in</strong> Chapter 3, it is crucial to note that official measurements<br />
of the <strong>Zimbabwe</strong>an economy often only reveal what happens <strong>in</strong><br />
the formal sector, despite the <strong>in</strong>formal sector hav<strong>in</strong>g become <strong>in</strong><br />
large part the ‘real economy’.<br />
<strong>The</strong> structure of the economy has been chang<strong>in</strong>g, largely <strong>in</strong><br />
response to the economic policies adopted by the state. Analyses<br />
of post-<strong>in</strong>dependence economic policy show that the economy has<br />
gone through three dist<strong>in</strong>ct policy sw<strong>in</strong>gs – from <strong>in</strong>terventionism<br />
(1980-1990) to structural adjustment (1991-1995) to management<br />
by crisis (1997 to 2008). At <strong>in</strong>dependence <strong>in</strong> 1980 the post-colonial<br />
state <strong>in</strong>herited and ma<strong>in</strong>ta<strong>in</strong>ed a diversified import substitut<strong>in</strong>g<br />
economy that had endured more than a decade of economic<br />
sanctions. Characterised by state <strong>in</strong>tervention <strong>in</strong> markets, dur<strong>in</strong>g<br />
this time manufactur<strong>in</strong>g, agriculture and distributive services<br />
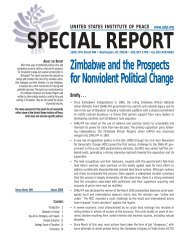
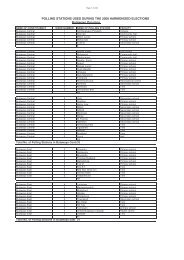
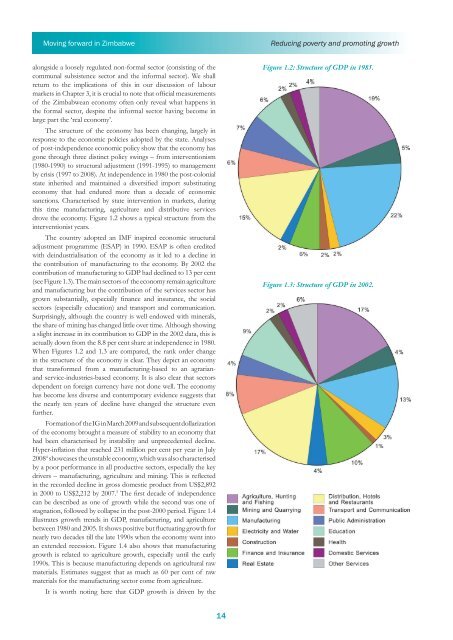
drove the economy. Figure 1.2 shows a typical structure from the<br />
<strong>in</strong>terventionist years.<br />
<strong>The</strong> country adopted an IMF <strong>in</strong>spired economic structural<br />
adjustment programme (ESAP) <strong>in</strong> 1990. ESAP is often credited<br />
with de<strong>in</strong>dustrialisation of the economy as it led to a decl<strong>in</strong>e <strong>in</strong><br />
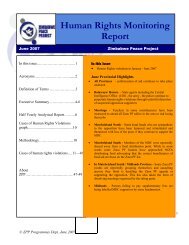
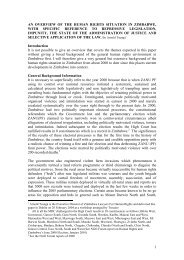
the contribution of manufactur<strong>in</strong>g to the economy. By 2002 the<br />
contribution of manufactur<strong>in</strong>g to GDP had decl<strong>in</strong>ed to 13 per cent<br />
(see Figure 1.3). <strong>The</strong> ma<strong>in</strong> sectors of the economy rema<strong>in</strong> agriculture<br />
and manufactur<strong>in</strong>g but the contribution of the services sector has<br />
grown substantially, especially f<strong>in</strong>ance and <strong>in</strong>surance, the social<br />
sectors (especially education) and transport and communication.<br />
Surpris<strong>in</strong>gly, although the country is well endowed with m<strong>in</strong>erals,<br />
the share of m<strong>in</strong><strong>in</strong>g has changed little over time. Although show<strong>in</strong>g<br />
a slight <strong>in</strong>crease <strong>in</strong> its contribution to GDP <strong>in</strong> the 2002 data, this is<br />
actually down from the 8.8 per cent share at <strong>in</strong>dependence <strong>in</strong> 1980.<br />
When Figures 1.2 and 1.3 are compared, the rank order change<br />
<strong>in</strong> the structure of the economy is clear. <strong>The</strong>y depict an economy<br />
that transformed from a manufactur<strong>in</strong>g-based to an agrarianand<br />
service-<strong>in</strong>dustries-based economy. It is also clear that sectors<br />
dependent on foreign currency have not done well. <strong>The</strong> economy<br />
has become less diverse and contemporary evidence suggests that<br />
the nearly ten years of decl<strong>in</strong>e have changed the structure even<br />
further.<br />
Formation of the IG <strong>in</strong> March 2009 and subsequent dollarization<br />
of the economy brought a measure of stability to an economy that<br />
had been characterised by <strong>in</strong>stability and unprecedented decl<strong>in</strong>e.<br />
Hyper-<strong>in</strong>flation that reached 231 million per cent per year <strong>in</strong> July<br />
2008 4 showcases the unstable economy, which was also characterised<br />
by a poor performance <strong>in</strong> all productive sectors, especially the key<br />
drivers – manufactur<strong>in</strong>g, agriculture and m<strong>in</strong><strong>in</strong>g. This is reflected<br />
<strong>in</strong> the recorded decl<strong>in</strong>e <strong>in</strong> gross domestic product from US$2,892<br />
<strong>in</strong> 2000 to US$2,212 by 2007. 5 <strong>The</strong> first decade of <strong>in</strong>dependence<br />
can be described as one of growth while the second was one of<br />
stagnation, followed by collapse <strong>in</strong> the post-2000 period. Figure 1.4<br />
illustrates growth trends <strong>in</strong> GDP, manufactur<strong>in</strong>g, and agriculture<br />
between 1980 and 2005. It shows positive but fluctuat<strong>in</strong>g growth for<br />
nearly two decades till the late 1990s when the economy went <strong>in</strong>to<br />
an extended recession. Figure 1.4 also shows that manufactur<strong>in</strong>g<br />
growth is related to agriculture growth, especially until the early<br />
1990s. This is because manufactur<strong>in</strong>g depends on agricultural raw<br />
materials. Estimates suggest that as much as 60 per cent of raw<br />
materials for the manufactur<strong>in</strong>g sector come from agriculture.<br />
It is worth not<strong>in</strong>g here that GDP growth is driven by the<br />
Figure 1.2: Structure of GDP <strong>in</strong> 1985.<br />
Figure 1.3: Structure of GDP <strong>in</strong> 2002.<br />
14