Moving forward in Zimbabwe - Brooks World Poverty Institute - The ...
Moving forward in Zimbabwe - Brooks World Poverty Institute - The ...
Moving forward in Zimbabwe - Brooks World Poverty Institute - The ...
You also want an ePaper? Increase the reach of your titles
YUMPU automatically turns print PDFs into web optimized ePapers that Google loves.
<strong>Mov<strong>in</strong>g</strong> <strong>forward</strong> <strong>in</strong> <strong>Zimbabwe</strong><br />
Reduc<strong>in</strong>g poverty and promot<strong>in</strong>g growth<br />
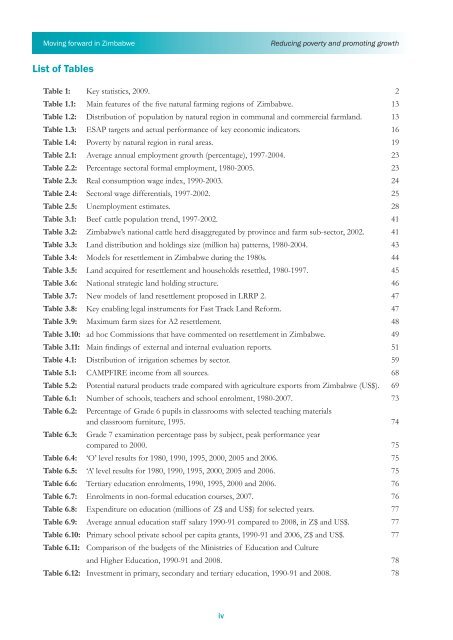
List of Tables<br />
Table 1: Key statistics, 2009. 2<br />
Table 1.1: Ma<strong>in</strong> features of the five natural farm<strong>in</strong>g regions of <strong>Zimbabwe</strong>. 13<br />
Table 1.2: Distribution of population by natural region <strong>in</strong> communal and commercial farmland. 13<br />
Table 1.3: ESAP targets and actual performance of key economic <strong>in</strong>dicators. 16<br />
Table 1.4: <strong>Poverty</strong> by natural region <strong>in</strong> rural areas. 19<br />
Table 2.1: Average annual employment growth (percentage), 1997-2004. 23<br />
Table 2.2: Percentage sectoral formal employment, 1980-2005. 23<br />
Table 2.3: Real consumption wage <strong>in</strong>dex, 1990-2003. 24<br />
Table 2.4: Sectoral wage differentials, 1997-2002. 25<br />
Table 2.5: Unemployment estimates. 28<br />
Table 3.1: Beef cattle population trend, 1997-2002. 41<br />
Table 3.2: <strong>Zimbabwe</strong>’s national cattle herd disaggregated by prov<strong>in</strong>ce and farm sub-sector, 2002. 41<br />
Table 3.3: Land distribution and hold<strong>in</strong>gs size (million ha) patterns, 1980-2004. 43<br />
Table 3.4: Models for resettlement <strong>in</strong> <strong>Zimbabwe</strong> dur<strong>in</strong>g the 1980s. 44<br />
Table 3.5: Land acquired for resettlement and households resettled, 1980-1997. 45<br />
Table 3.6: National strategic land hold<strong>in</strong>g structure. 46<br />
Table 3.7: New models of land resettlement proposed <strong>in</strong> LRRP 2. 47<br />
Table 3.8: Key enabl<strong>in</strong>g legal <strong>in</strong>struments for Fast Track Land Reform. 47<br />
Table 3.9: Maximum farm sizes for A2 resettlement. 48<br />
Table 3.10: ad hoc Commissions that have commented on resettlement <strong>in</strong> <strong>Zimbabwe</strong>. 49<br />
Table 3.11: Ma<strong>in</strong> f<strong>in</strong>d<strong>in</strong>gs of external and <strong>in</strong>ternal evaluation reports. 51<br />
Table 4.1: Distribution of irrigation schemes by sector. 59<br />
Table 5.1: CAMPFIRE <strong>in</strong>come from all sources. 68<br />
Table 5.2: Potential natural products trade compared with agriculture exports from <strong>Zimbabwe</strong> (US$). 69<br />
Table 6.1: Number of schools, teachers and school enrolment, 1980-2007. 73<br />
Table 6.2:<br />
Table 6.3:<br />
Percentage of Grade 6 pupils <strong>in</strong> classrooms with selected teach<strong>in</strong>g materials<br />
and classroom furniture, 1995. 74<br />
Grade 7 exam<strong>in</strong>ation percentage pass by subject, peak performance year<br />
compared to 2000. 75<br />
Table 6.4: ‘O’ level results for 1980, 1990, 1995, 2000, 2005 and 2006. 75<br />
Table 6.5: ‘A’ level results for 1980, 1990, 1995, 2000, 2005 and 2006. 75<br />
Table 6.6: Tertiary education enrolments, 1990, 1995, 2000 and 2006. 76<br />
Table 6.7: Enrolments <strong>in</strong> non-formal education courses, 2007. 76<br />
Table 6.8: Expenditure on education (millions of Z$ and US$) for selected years. 77<br />
Table 6.9: Average annual education staff salary 1990-91 compared to 2008, <strong>in</strong> Z$ and US$. 77<br />
Table 6.10: Primary school private school per capita grants, 1990-91 and 2006, Z$ and US$. 77<br />
Table 6.11: Comparison of the budgets of the M<strong>in</strong>istries of Education and Culture<br />
and Higher Education, 1990-91 and 2008. 78<br />
Table 6.12: Investment <strong>in</strong> primary, secondary and tertiary education, 1990-91 and 2008. 78<br />
iv


