Moving forward in Zimbabwe - Brooks World Poverty Institute - The ...
Moving forward in Zimbabwe - Brooks World Poverty Institute - The ...
Moving forward in Zimbabwe - Brooks World Poverty Institute - The ...

You also want an ePaper? Increase the reach of your titles
YUMPU automatically turns print PDFs into web optimized ePapers that Google loves.
<strong>Mov<strong>in</strong>g</strong> <strong>forward</strong> <strong>in</strong> <strong>Zimbabwe</strong><br />
Reduc<strong>in</strong>g poverty and promot<strong>in</strong>g growth<br />
It is clear from Tables 6.9 and 6.10 that after 2000 the level<br />
of <strong>in</strong>vestment <strong>in</strong> staff salaries and per capita grants was variable<br />
from year to year, but it was severely eroded by <strong>in</strong>flation. A return<br />
to the 22 per cent of the total state budget pattern of <strong>in</strong>vestment<br />
<strong>in</strong>to education and tra<strong>in</strong><strong>in</strong>g as a target would be a salutary first step<br />
<strong>in</strong> any new dispensation. A second step would be to try and ensure<br />
that staff salaries are reasonable enough to satisfy basic needs. By<br />
the time the IG was formed staff salaries <strong>in</strong> US$ terms were a<br />
paltry 12 per cent of the average salary <strong>in</strong> 1990. <strong>The</strong> poor work<strong>in</strong>g<br />
conditions accounted for the bra<strong>in</strong> dra<strong>in</strong> of teach<strong>in</strong>g staff, many of<br />
whom were not able to utilise their academic and professional skills<br />
<strong>in</strong> the jobs they hold outside the country.<br />
Per capita grants have shrunk to less than one US cent per<br />
child <strong>in</strong> 2008 compared to US$6.26 <strong>in</strong> 1990-91 (see Table 6.10),<br />
and this expla<strong>in</strong>s why schools are unable to purchase textbooks<br />
and other teach<strong>in</strong>g/learn<strong>in</strong>g materials. Note that the average<br />
textbook <strong>in</strong> <strong>Zimbabwe</strong> costs about US$7, very high by regional<br />
and <strong>in</strong>ternational standards. It may be useful to utilise 1990-91 as<br />
a benchmark. At that time <strong>in</strong>vestment <strong>in</strong> education was US$581<br />
million, of which about US$456 million, 78.5 per cent of the<br />
total, was for staff salaries. Whilst it may not be possible to return<br />
very quickly to this level of real <strong>in</strong>vestment, it will nevertheless be<br />
essential to plan a closer approximation.<br />
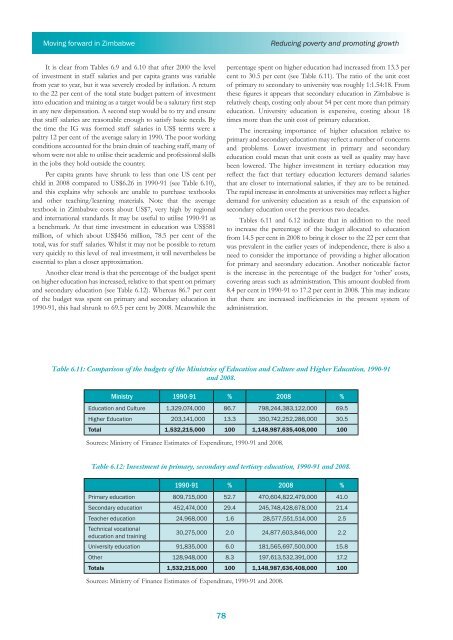
Another clear trend is that the percentage of the budget spent<br />
on higher education has <strong>in</strong>creased, relative to that spent on primary<br />
and secondary education (see Table 6.12). Whereas 86.7 per cent<br />
of the budget was spent on primary and secondary education <strong>in</strong><br />
1990-91, this had shrunk to 69.5 per cent by 2008. Meanwhile the<br />
percentage spent on higher education had <strong>in</strong>creased from 13.3 per<br />
cent to 30.5 per cent (see Table 6.11). <strong>The</strong> ratio of the unit cost<br />
of primary to secondary to university was roughly 1:1.54:18. From<br />
these figures it appears that secondary education <strong>in</strong> <strong>Zimbabwe</strong> is<br />
relatively cheap, cost<strong>in</strong>g only about 54 per cent more than primary<br />
education. University education is expensive, cost<strong>in</strong>g about 18<br />
times more than the unit cost of primary education.<br />
<strong>The</strong> <strong>in</strong>creas<strong>in</strong>g importance of higher education relative to<br />
primary and secondary education may reflect a number of concerns<br />
and problems. Lower <strong>in</strong>vestment <strong>in</strong> primary and secondary<br />
education could mean that unit costs as well as quality may have<br />
been lowered. <strong>The</strong> higher <strong>in</strong>vestment <strong>in</strong> tertiary education may<br />
reflect the fact that tertiary education lecturers demand salaries<br />
that are closer to <strong>in</strong>ternational salaries, if they are to be reta<strong>in</strong>ed.<br />
<strong>The</strong> rapid <strong>in</strong>crease <strong>in</strong> enrolments at universities may reflect a higher<br />
demand for university education as a result of the expansion of<br />
secondary education over the previous two decades.<br />
Tables 6.11 and 6.12 <strong>in</strong>dicate that <strong>in</strong> addition to the need<br />
to <strong>in</strong>crease the percentage of the budget allocated to education<br />
from 14.5 per cent <strong>in</strong> 2008 to br<strong>in</strong>g it closer to the 22 per cent that<br />
was prevalent <strong>in</strong> the earlier years of <strong>in</strong>dependence, there is also a<br />
need to consider the importance of provid<strong>in</strong>g a higher allocation<br />
for primary and secondary education. Another noticeable factor<br />
is the <strong>in</strong>crease <strong>in</strong> the percentage of the budget for ‘other’ costs,<br />
cover<strong>in</strong>g areas such as adm<strong>in</strong>istration. This amount doubled from<br />
8.4 per cent <strong>in</strong> 1990-91 to 17.2 per cent <strong>in</strong> 2008. This may <strong>in</strong>dicate<br />
that there are <strong>in</strong>creased <strong>in</strong>efficiencies <strong>in</strong> the present system of<br />
adm<strong>in</strong>istration.<br />
Table 6.11: Comparison of the budgets of the M<strong>in</strong>istries of Education and Culture and Higher Education, 1990-91<br />
and 2008.<br />
M<strong>in</strong>istry 1990-91 % 2008 %<br />
Education and Culture 1,329,074,000 86.7 798,244,383,122,000 69.5<br />
Higher Education 203,141,000 13.3 350,742,252,286,000 30.5<br />
Total 1,532,215,000 100 1,148,987,635,408,000 100<br />
Sources: M<strong>in</strong>istry of F<strong>in</strong>ance Estimates of Expenditure, 1990-91 and 2008.<br />
Table 6.12: Investment <strong>in</strong> primary, secondary and tertiary education, 1990-91 and 2008.<br />
1990-91 % 2008 %<br />
Primary education 809,715,000 52.7 470,604,822,479,000 41.0<br />
Secondary education 452,474,000 29.4 245,748,428,678,000 21.4<br />
Teacher education 24,968,000 1.6 28,577,551,514,000 2.5<br />
Technical vocational<br />
education and tra<strong>in</strong><strong>in</strong>g<br />
30,275,000 2.0 24,877,603,846,000 2.2<br />
University education 91,835,000 6.0 181,565,697,500,000 15.8<br />
Other 128,948,000 8.3 197,613,532,391,000 17.2<br />
Totals 1,532,215,000 100 1,148,987,636,408,000 100<br />
Sources: M<strong>in</strong>istry of F<strong>in</strong>ance Estimates of Expenditure, 1990-91 and 2008.<br />
78