Moving forward in Zimbabwe - Brooks World Poverty Institute - The ...
Moving forward in Zimbabwe - Brooks World Poverty Institute - The ...
Moving forward in Zimbabwe - Brooks World Poverty Institute - The ...

You also want an ePaper? Increase the reach of your titles
YUMPU automatically turns print PDFs into web optimized ePapers that Google loves.
<strong>Mov<strong>in</strong>g</strong> <strong>forward</strong> <strong>in</strong> <strong>Zimbabwe</strong><br />
Reduc<strong>in</strong>g poverty and promot<strong>in</strong>g growth<br />
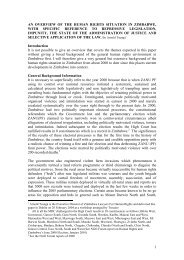
performance of the agriculture and manufactur<strong>in</strong>g sectors. Each<br />
time a drought occurs (about once every four years), these two<br />
sectors of the economy underperform and drag GDP growth<br />
down. 6 Figure 1.5 shows the fluctuations <strong>in</strong> their contributions to<br />
GDP. <strong>The</strong> three sectors, which contributed over 40 per cent of<br />
GDP <strong>in</strong> any given year, significantly <strong>in</strong>fluence what happens to the<br />
economy. <strong>The</strong> l<strong>in</strong>k here is with ra<strong>in</strong>fall patterns. Analysis of GDP<br />
growth and ra<strong>in</strong>fall data for the first 16 years of <strong>in</strong>dependence has<br />
found a correlation co-efficient of 70 per cent. 7<br />
<strong>The</strong> performance of agriculture and manufactur<strong>in</strong>g also<br />
<strong>in</strong>fluences what happens to employment growth <strong>in</strong> the formal<br />
sector, as Figure 1.6 shows. It is clear that formal employment<br />
had also shrunk substantially, from about 3.6 million <strong>in</strong> 2003 to an<br />
estimated 480,000 by 2008.<br />
In the next section we look at some of the key causes of this<br />
socio-economic decl<strong>in</strong>e that is now commonly referred to as a<br />
crisis.<br />
1.4 Multiple causes of the <strong>Zimbabwe</strong> crisis<br />
Figure 1.4: Key economic trends, 1980-2005.<br />
Data sourced from <strong>World</strong> Bank tables and are based on 2000 prices. Note this uses value-added figures derived from the<br />
difference between output price and cost of <strong>in</strong>termediate <strong>in</strong>puts.<br />
Figure 1.5: Contribution of agriculture, manufactur<strong>in</strong>g and m<strong>in</strong><strong>in</strong>g to GDP.<br />
15