Moving forward in Zimbabwe - Brooks World Poverty Institute - The ...
Moving forward in Zimbabwe - Brooks World Poverty Institute - The ...
Moving forward in Zimbabwe - Brooks World Poverty Institute - The ...

Create successful ePaper yourself
Turn your PDF publications into a flip-book with our unique Google optimized e-Paper software.
<strong>Mov<strong>in</strong>g</strong> <strong>forward</strong> <strong>in</strong> <strong>Zimbabwe</strong><br />
Reduc<strong>in</strong>g poverty and promot<strong>in</strong>g growth<br />
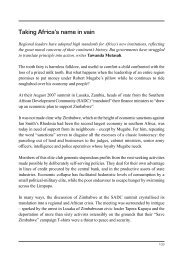
Table 6.3: Grade 7 exam<strong>in</strong>ation percentage pass by<br />
subject, peak performance year compared to 2000.<br />
Subject<br />
146). A possible explanation for the decl<strong>in</strong>e <strong>in</strong> pass rates may be the<br />
deterioration <strong>in</strong> <strong>in</strong>frastructure over time. This trend is also reflected<br />
when we consider the quality of read<strong>in</strong>g comprehension <strong>in</strong> English<br />
reflected <strong>in</strong> the SACMEQ study. This shows that only 56.4 per cent<br />
of Grade 6 pupils atta<strong>in</strong>ed the m<strong>in</strong>imal level of mastery, whilst only<br />
37.0 per cent reached the desirable level of mastery (Mach<strong>in</strong>gaidze<br />
et al, 1998: 70). While these f<strong>in</strong>d<strong>in</strong>gs <strong>in</strong>dicate that much had been<br />
achieved <strong>in</strong> primary education, there was still a great deal of<br />
work to be done by the end of the 1990s. Sadly there was little<br />
difference between the results <strong>in</strong> 1995 and those of 1991, show<strong>in</strong>g<br />
that already the rate of improvement was beg<strong>in</strong>n<strong>in</strong>g to slow down.<br />
Read together with the Grade 7 public exam<strong>in</strong>ation results given<br />
<strong>in</strong> Table 6.3, we could say this reflects some systemic issues <strong>in</strong> the<br />
education system.<br />
Although there were no significant rural/urban differences <strong>in</strong><br />
primary school attendance reflected <strong>in</strong> the data (50.4 per cent boys<br />
as compared to 49.6 per cent girls <strong>in</strong> 2006), fewer girls attended<br />
secondary school, with 51.9 per cent boys and 48.1 per cent girls<br />
<strong>in</strong> 2006 (M<strong>in</strong>istry of Education, Sport and Culture, 2007a: 44).<br />
Although the gender gap has been gradually decreas<strong>in</strong>g at secondary<br />
level, these data do suggest that the crisis may have affected girls’<br />
attendance of secondary education more that it did that of boys.<br />
Secondary education<br />
Peak year<br />
result<br />
2000 result<br />
2000 result<br />
as % of peak<br />
year result<br />
English 83.3 (1997) 73.0 87.6<br />
Mathematics 73.4 (1997) 62.3 84.9<br />
Shona 90.6 (1997) 89.5 98.9<br />
Ndebele 86.0 (2000) 86.0 100.0<br />
General Paper 81.2 (1998) 78.0 96.1<br />
Source: CSO, 2001b: 30. Unfortunately we could not obta<strong>in</strong> more<br />
recent Grade 7 results.<br />
<strong>The</strong> impressive improvements <strong>in</strong> secondary education <strong>in</strong>frastructure<br />
and enrolments raised expectations as to the quality of human<br />
capital formation and <strong>in</strong>deed <strong>Zimbabwe</strong> became recognised for<br />
its achievements <strong>in</strong> education. If we use quality of secondary<br />
education as measured by the ‘O’ and ‘A’ level exam<strong>in</strong>ations, we<br />
can get an idea of the value addition with<strong>in</strong> this system. Table 6.4<br />
shows that whilst the number of candidates who passed five or<br />
more subjects at ‘O’ level <strong>in</strong>creased from 535 <strong>in</strong> 1980, to 31,246<br />
<strong>in</strong> 2006, the percentage who passed five subjects reached its peak<br />
<strong>in</strong> the 1990s at 23 per cent. By 2000 the percentage had shrunk<br />
to 14 per cent, with a mean of 13 per cent from 2000 to 2006.<br />
Those who failed all subjects comprised 40 per cent of the total,<br />
whilst those who passed between one and three subjects comprised<br />
another 40 per cent between 1981 and 1990 (Chung, 2008: 36).<br />
<strong>The</strong> fact that only 13-23 per cent of students pass five ‘O’<br />
levels, imply<strong>in</strong>g a failure rate of between 77 and 87 per cent, is a<br />
serious <strong>in</strong>dictment of the education system. Given that by 2000<br />
only 2.8 per cent of secondary teachers were unqualified out of<br />
a total of 34,163, this high failure rate is somewhat surpris<strong>in</strong>g and<br />
may also po<strong>in</strong>t to systemic failures with<strong>in</strong> the education system. It<br />
Year<br />
has been suggested that ‘O’ levels are basically a preparation for<br />
university work and unsuited to the 96 per cent of the age group<br />
that do not make it <strong>in</strong>to university. It does suggest that secondary<br />
school students are not be<strong>in</strong>g educated and tra<strong>in</strong>ed to take advantage<br />
of the opportunities and challenges they will face.<br />
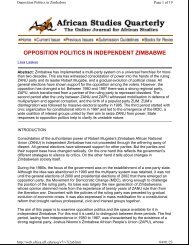
<strong>The</strong> ‘A’ level results were much better (Table 6.5), show<strong>in</strong>g<br />
a marked improvement, from 46 per cent pass<strong>in</strong>g two or more<br />
subjects <strong>in</strong> 1980 to 75 per cent <strong>in</strong> 2006. <strong>The</strong> number who obta<strong>in</strong>ed<br />
two passes had <strong>in</strong>creased from 527 to 25,106. <strong>The</strong> results at this<br />
level are due to the high level of selection for ‘A’ levels (compare<br />
the number of candidates for ‘O’ levels <strong>in</strong> Table 6.4 to the number<br />
for ‘A’ levels <strong>in</strong> Table 6.5).<br />
Year<br />
Table 6.4: ‘O’ level results for 1980, 1990, 1995,<br />
2000, 2005 and 2006.<br />
Table 6.5: ‘A’ level results for 1980, 1990, 1995,<br />
2000, 2005 and 2006.<br />
Number of<br />
candidates<br />
Number with 2<br />
Es or better<br />
% with 2 Es<br />
or better<br />
1980 527 242 46<br />
1990 14,722 9,984 58<br />
1995 17,803 13,163 70<br />
2000 19,541 18,044 75<br />
2005 36,854 26,415 72<br />
2006 33,516 25,106 75<br />
Sources: CSO, 2001b: 43 for 1980-1995, and <strong>Zimbabwe</strong> School<br />
Exam<strong>in</strong>ation Council, August, 2008, for 2000-2006.<br />
Tertiary education<br />
Number of<br />
candidates<br />
Number with 5<br />
Cs or more<br />
% with 5 Cs<br />
1980 8,351 535 6<br />
1990 201,555 12,201 21<br />
1995 197,512 12,238 23<br />
2000 264,056 36,659 14<br />
2005 251,755 31,246 12<br />
2006 223,968 31,246 14<br />
Sources: CSO, 2001b: 42 for 1980-1995, and <strong>Zimbabwe</strong> School<br />
Exam<strong>in</strong>ation Council, August, 2008, for 2000-2006.<br />
At university level <strong>in</strong> 2006, male students comprised 62.6 per cent<br />
of the total. Although there has been a narrow<strong>in</strong>g of the gender gap<br />
over the decades, there are serious gender gaps at tertiary education<br />
level, <strong>in</strong> terms of both staff<strong>in</strong>g and student enrolments, and these<br />
gaps are l<strong>in</strong>ked to specific subject specialisations (Tichagwa, 2007).<br />
This is an area for more concerted and practical policy and strategy<br />
work, <strong>in</strong>volv<strong>in</strong>g each <strong>in</strong>stitution <strong>in</strong> practical implementation<br />
programmes. Table 6.6 <strong>in</strong>dicates an enormous <strong>in</strong>crease <strong>in</strong> the<br />
enrolment of students at university level, caused partly by the<br />
<strong>in</strong>crease <strong>in</strong> the number of universities from one <strong>in</strong> 1980, to four <strong>in</strong><br />
1994 and to 11 <strong>in</strong> 2006. A noticeable change was the emergence of<br />
five private universities by 2006. <strong>The</strong>se five universities comprised<br />
4,650 students out of a total of 53,560 students <strong>in</strong> 2006, 8.7 per<br />
cent of the total. <strong>The</strong>re appears to be room for further expansion<br />
of private universities, although there is also a need to monitor the<br />
75