Shark Depredation and Unwanted Bycatch in Pelagic Longline
Shark Depredation and Unwanted Bycatch in Pelagic Longline
Shark Depredation and Unwanted Bycatch in Pelagic Longline

You also want an ePaper? Increase the reach of your titles
YUMPU automatically turns print PDFs into web optimized ePapers that Google loves.
<strong>Shark</strong> <strong>Depredation</strong> <strong>and</strong> <strong>Unwanted</strong> <strong>Bycatch</strong> <strong>in</strong> <strong>Pelagic</strong> Longl<strong>in</strong>e Fisheries<br />
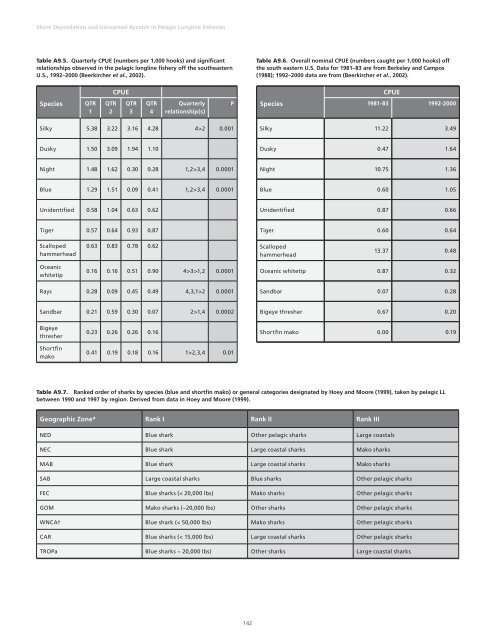
Table A9.5. Quarterly CPUE (numbers per 1,000 hooks) <strong>and</strong> significant<br />
relationships observed <strong>in</strong> the pelagic longl<strong>in</strong>e fishery off the southeastern<br />
U.S., 1992–2000 (Beerkircher et al., 2002).<br />
Table A9.6. Overall nom<strong>in</strong>al CPUE (numbers caught per 1,000 hooks) off<br />
the south eastern U.S. Data for 1981–83 are from Berkeley <strong>and</strong> Campos<br />
(1988); 1992–2000 data are from (Beerkircher et al., 2002).<br />
CPUE<br />
CPUE<br />
Species<br />
QTR<br />
1<br />
QTR<br />
2<br />
QTR<br />
3<br />
QTR<br />
4<br />
Quarterly<br />
relationship(s)<br />
P<br />
Species 1981-83 1992-2000<br />
Silky 5.38 3.22 3.16 4.28 4>2 0.001<br />
Silky 11.22 3.49<br />
Dusky 1.50 3.09 1.94 1.10<br />
Dusky 0.47 1.64<br />
Night 1.48 1.62 0.30 0.28 1,2>3,4 0.0001<br />
Night 10.75 1.36<br />
Blue 1.29 1.51 0.09 0.41 1,2>3,4 0.0001<br />
Blue 0.60 1.05<br />
Unidentified 0.58 1.04 0.63 0.62<br />
Unidentified 0.87 0.66<br />
Tiger 0.57 0.64 0.93 0.87<br />
Tiger 0.60 0.64<br />
Scalloped<br />
hammerhead<br />
0.63 0.83 0.78 0.62<br />
Scalloped<br />
hammerhead<br />
13.37 0.48<br />
Oceanic<br />
whitetip<br />
0.16 0.16 0.51 0.90 4>3>1,2 0.0001<br />
Oceanic whitetip 0.87 0.32<br />
Rays 0.28 0.09 0.45 0.49 4,3,1>2 0.0001<br />
S<strong>and</strong>bar 0.07 0.28<br />
S<strong>and</strong>bar 0.21 0.59 0.30 0.07 2>1,4 0.0002<br />
Bigeye thresher 0.67 0.20<br />
Bigeye<br />
thresher<br />
Shortf<strong>in</strong><br />
mako<br />
0.23 0.26 0.26 0.16<br />
0.41 0.19 0.18 0.16 1>2,3,4 0.01<br />
Shortf<strong>in</strong> mako 0.00 0.19<br />
Table A9.7. Ranked order of sharks by species (blue <strong>and</strong> shortf<strong>in</strong> mako) or general categories designated by Hoey <strong>and</strong> Moore (1999), taken by pelagic LL<br />
between 1990 <strong>and</strong> 1997 by region. Derived from data <strong>in</strong> Hoey <strong>and</strong> Moore (1999).<br />
Geographic Zone* Rank I Rank II Rank III<br />
NED Blue shark Other pelagic sharks Large coastals<br />
NEC Blue shark Large coastal sharks Mako sharks<br />
MAB Blue shark Large coastal sharks Mako sharks<br />
SAB Large coastal sharks Blue sharks Other pelagic sharks<br />
FEC Blue sharks (< 20,000 lbs) Mako sharks Other pelagic sharks<br />
GOM Mako sharks (~20,000 lbs) Other sharks Other pelagic sharks<br />
WNCA† Blue shark (< 50,000 lbs) Mako sharks Other pelagic sharks<br />
CAR Blue sharks (< 15,000 lbs) Large coastal sharks Other pelagic sharks<br />
TROPa Blue sharks ~ 20,000 lbs) Other sharks Large coastal sharks<br />
142