Shark Depredation and Unwanted Bycatch in Pelagic Longline
Shark Depredation and Unwanted Bycatch in Pelagic Longline
Shark Depredation and Unwanted Bycatch in Pelagic Longline

You also want an ePaper? Increase the reach of your titles
YUMPU automatically turns print PDFs into web optimized ePapers that Google loves.
<strong>Shark</strong> Catch Rates <strong>and</strong> Disposition<br />
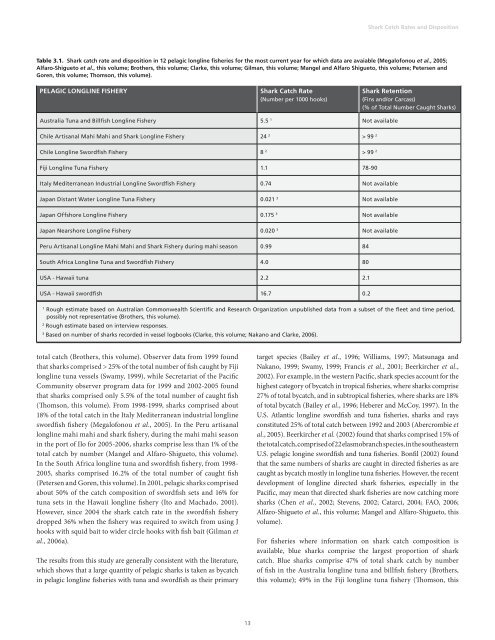
Table 3.1. <strong>Shark</strong> catch rate <strong>and</strong> disposition <strong>in</strong> 12 pelagic longl<strong>in</strong>e fisheries for the most current year for which data are avaiable (Megalofonou et al., 2005;<br />
Alfaro-Shigueto et al., this volume; Brothers, this volume; Clarke, this volume; Gilman, this volume; Mangel <strong>and</strong> Alfaro Shigueto, this volume; Petersen <strong>and</strong><br />
Goren, this volume; Thomson, this volume).<br />
<strong>Pelagic</strong> Longl<strong>in</strong>e Fishery<br />
<strong>Shark</strong> Catch Rate<br />
(Number per 1000 hooks)<br />
<strong>Shark</strong> Retention<br />
(F<strong>in</strong>s <strong>and</strong>/or Carcass)<br />
(% of Total Number Caught <strong>Shark</strong>s)<br />
Australia Tuna <strong>and</strong> Billfish Longl<strong>in</strong>e Fishery 5.5 1 Not available<br />
Chile Artisanal Mahi Mahi <strong>and</strong> <strong>Shark</strong> Longl<strong>in</strong>e Fishery 24 2 > 99 2<br />
Chile Longl<strong>in</strong>e Swordfish Fishery 8 2 > 99 2<br />
Fiji Longl<strong>in</strong>e Tuna Fishery 1.1 78-90<br />
Italy Mediterranean Industrial Longl<strong>in</strong>e Swordfish Fishery 0.74 Not available<br />
Japan Distant Water Longl<strong>in</strong>e Tuna Fishery 0.021 3 Not available<br />
Japan Offshore Longl<strong>in</strong>e Fishery 0.175 3 Not available<br />
Japan Nearshore Longl<strong>in</strong>e Fishery 0.020 3 Not available<br />
Peru Artisanal Longl<strong>in</strong>e Mahi Mahi <strong>and</strong> <strong>Shark</strong> Fishery dur<strong>in</strong>g mahi season 0.99 84<br />
South Africa Longl<strong>in</strong>e Tuna <strong>and</strong> Swordfish Fishery 4.0 80<br />
USA - Hawaii tuna 2.2 2.1<br />
USA - Hawaii swordfish 16.7 0.2<br />
1<br />
Rough estimate based on Australian Commonwealth Scientific <strong>and</strong> Research Organization unpublished data from a subset of the fleet <strong>and</strong> time period,<br />
possibly not representative (Brothers, this volume).<br />
2<br />
Rough estimate based on <strong>in</strong>terview responses.<br />
3<br />
Based on number of sharks recorded <strong>in</strong> vessel logbooks (Clarke, this volume; Nakano <strong>and</strong> Clarke, 2006).<br />
total catch (Brothers, this volume). Observer data from 1999 found<br />
that sharks comprised > 25% of the total number of fish caught by Fiji<br />
longl<strong>in</strong>e tuna vessels (Swamy, 1999), while Secretariat of the Pacific<br />
Community observer program data for 1999 <strong>and</strong> 2002-2005 found<br />
that sharks comprised only 5.5% of the total number of caught fish<br />
(Thomson, this volume). From 1998-1999, sharks comprised about<br />
18% of the total catch <strong>in</strong> the Italy Mediterranean <strong>in</strong>dustrial longl<strong>in</strong>e<br />
swordfish fishery (Megalofonou et al., 2005). In the Peru artisanal<br />
longl<strong>in</strong>e mahi mahi <strong>and</strong> shark fishery, dur<strong>in</strong>g the mahi mahi season<br />
<strong>in</strong> the port of Ilo for 2005-2006, sharks comprise less than 1% of the<br />
total catch by number (Mangel <strong>and</strong> Alfaro-Shigueto, this volume).<br />
In the South Africa longl<strong>in</strong>e tuna <strong>and</strong> swordfish fishery, from 1998-<br />
2005, sharks comprised 16.2% of the total number of caught fish<br />
(Petersen <strong>and</strong> Goren, this volume). In 2001, pelagic sharks comprised<br />
about 50% of the catch composition of swordfish sets <strong>and</strong> 16% for<br />
tuna sets <strong>in</strong> the Hawaii longl<strong>in</strong>e fishery (Ito <strong>and</strong> Machado, 2001).<br />
However, s<strong>in</strong>ce 2004 the shark catch rate <strong>in</strong> the swordfish fishery<br />
dropped 36% when the fishery was required to switch from us<strong>in</strong>g J<br />
hooks with squid bait to wider circle hooks with fish bait (Gilman et<br />
al., 2006a).<br />
The results from this study are generally consistent with the literature,<br />
which shows that a large quantity of pelagic sharks is taken as bycatch<br />
<strong>in</strong> pelagic longl<strong>in</strong>e fisheries with tuna <strong>and</strong> swordfish as their primary<br />
target species (Bailey et al., 1996; Williams, 1997; Matsunaga <strong>and</strong><br />
Nakano, 1999; Swamy, 1999; Francis et al., 2001; Beerkircher et al.,<br />
2002). For example, <strong>in</strong> the western Pacific, shark species account for the<br />
highest category of bycatch <strong>in</strong> tropical fisheries, where sharks comprise<br />
27% of total bycatch, <strong>and</strong> <strong>in</strong> subtropical fisheries, where sharks are 18%<br />
of total bycatch (Bailey et al., 1996; Heberer <strong>and</strong> McCoy, 1997). In the<br />
U.S. Atlantic longl<strong>in</strong>e swordfish <strong>and</strong> tuna fisheries, sharks <strong>and</strong> rays<br />
constituted 25% of total catch between 1992 <strong>and</strong> 2003 (Abercrombie et<br />
al., 2005). Beerkircher et al. (2002) found that sharks comprised 15% of<br />
the total catch, comprised of 22 elasmobranch species, <strong>in</strong> the southeastern<br />
U.S. pelagic long<strong>in</strong>e swordfish <strong>and</strong> tuna fisheries. Bonfil (2002) found<br />
that the same numbers of sharks are caught <strong>in</strong> directed fisheries as are<br />
caught as bycatch mostly <strong>in</strong> longl<strong>in</strong>e tuna fisheries. However, the recent<br />
development of longl<strong>in</strong>e directed shark fisheries, especially <strong>in</strong> the<br />
Pacific, may mean that directed shark fisheries are now catch<strong>in</strong>g more<br />
sharks (Chen et al., 2002; Stevens, 2002; Catarci, 2004; FAO, 2006;<br />
Alfaro-Shigueto et al., this volume; Mangel <strong>and</strong> Alfaro-Shigueto, this<br />
volume).<br />
For fisheries where <strong>in</strong>formation on shark catch composition is<br />
available, blue sharks comprise the largest proportion of shark<br />
catch. Blue sharks comprise 47% of total shark catch by number<br />
of fish <strong>in</strong> the Australia longl<strong>in</strong>e tuna <strong>and</strong> billfish fishery (Brothers,<br />
this volume); 49% <strong>in</strong> the Fiji longl<strong>in</strong>e tuna fishery (Thomson, this<br />
13