Our new Biological Assessment is out - Klamath Basin Crisis
Our new Biological Assessment is out - Klamath Basin Crisis
Our new Biological Assessment is out - Klamath Basin Crisis

You also want an ePaper? Increase the reach of your titles
YUMPU automatically turns print PDFs into web optimized ePapers that Google loves.
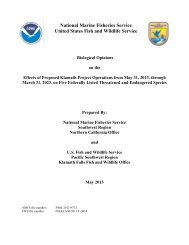
<strong>Klamath</strong> Project Operations <strong>Biological</strong> <strong>Assessment</strong><br />
Contents<br />
Figure 2-19. State of Oregon, Div<strong>is</strong>ion 5, average annual temperature, 1895 to<br />
2004. ............................................................................................................... 1<br />
Figure 2-20. Graphical representation of end of the month lake elevations in UKL<br />
with the <strong>Biological</strong> lake minimums (Bio, green x) and Operational lake<br />
targets (Oper, black asterik)............................................................................ 1<br />
Figure 2-21. Relationship between chlorophyll and median August lake<br />
elevation.......................................................................................................... 1<br />
Figure 2-22. Summary of 1990-2006 UKL elevations. ......................................... 1<br />
Figure 2-23. UKL relationship between June 15 lake elevation (red x) and larval<br />
sucker abundance for larvae of 15 mm total length (LPE15; blue square)<br />
from 1995 through 2005. ................................................................................ 1<br />
Figure 2-24. Annual estimates of early larval Lost River and shortnose sucker<br />
survival in UKL, 1995-2005. ........................................................................ 1<br />
Figure 3-1. Lower <strong>Klamath</strong> River <strong>Basin</strong> includes the <strong>Klamath</strong> River drainage<br />
below the IGD................................................................................................. 1<br />
Figure 3-2. Adult coho salmon counted at Iron Gate Hatchery (top graph) and at<br />
the Trinity River weir on Willow Creek (bottom graph), 1992 to 2006. ...... 1<br />
Figure 3-3. Passage timing d<strong>is</strong>tributions of coho salmon smolts at three main<br />
stem <strong>Klamath</strong> River Trapping locations. . ..................................................... 1<br />
Figure 3-4. The rotary screw trap on Willow Creek, a tributary of Trinity River. 1<br />
Figure 3-5. Natural-origin coho salmon smolt captured in downstream migrant<br />
traps in the main stem <strong>Klamath</strong> River and various tributaries by year 1998 to<br />
2006................................................................................................................. 1<br />
Figure 3-6. Estimated run size of natural-origin coho salmon to the <strong>Klamath</strong><br />
River using the Harvest Samplings Approach, 1999 through 2005................ 1<br />
Figure 3-7. SONCC coho salmon ESU reflecting independent populations......... 1<br />
Figure 3-8. Arrangement of the h<strong>is</strong>torical populations within the SONCC coho<br />
salmon ESU. ................................................................................................... 1<br />
Figure 3-9. Div<strong>is</strong>ion 5, High Plateau of the Oregon Climatic Div<strong>is</strong>ions, includes<br />
drainages of the UKL...................................................................................... 1<br />
Figure 3-10. State of Oregon, Div<strong>is</strong>ion 5, October through March, accumulated<br />
precipitation, 1895 to 2004. ............................................................................ 1<br />
Figure 3-11. State of Oregon, Div<strong>is</strong>ion 5, average annual temperature, 1985 to<br />
2004................................................................................................................. 1<br />
Figure 3-12. Hourly water temperature at river mile 150 of the <strong>Klamath</strong> River.<br />
<strong>Klamath</strong> River <strong>is</strong> currently considered a relatively warm water system. ..... 1<br />
Figure 3-13. The 2002 to 2012 NMFS BO recommended long-term IGD<br />
d<strong>is</strong>charge by water year type, by month. ........................................................ 1<br />
Figure 3-14. The proposed minimum flows, the 1961 to 2006 50 percent<br />
exceedence, and the model (2008 to 2018) 25, 50, and 75 percent<br />
exceedences..................................................................................................... 1<br />
Figure 3-15. Longitudinal view of daily mean water temperatures from IGD to<br />
Turwar, on June 1 in a typical year................................................................. 1<br />
Figure 3-16. Simulated seasonal flows in the <strong>Klamath</strong> River from Link River to<br />
Turwar in 2000................................................................................................ 1<br />
x