Our new Biological Assessment is out - Klamath Basin Crisis
Our new Biological Assessment is out - Klamath Basin Crisis
Our new Biological Assessment is out - Klamath Basin Crisis

Create successful ePaper yourself
Turn your PDF publications into a flip-book with our unique Google optimized e-Paper software.
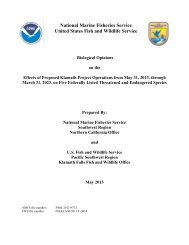
<strong>Klamath</strong> Project Operations <strong>Biological</strong> <strong>Assessment</strong><br />
Contents<br />
Tables<br />
Table 1-1. Seasonal variance in inflows for the entire period of April through<br />
September. (variation in UKL inflow for six years with similar total inflow).<br />
......................................................................................................................... 1<br />
Table 1-2. LRDC and KSD contributions to the <strong>Klamath</strong> River (in thousands of<br />
acre feet).......................................................................................................... 1<br />
Table 1-3. Minimum flows for the <strong>Klamath</strong> River................................................ 1<br />
Table 1-4. Minimum elevations at UKL................................................................ 1<br />
Table 1-5. Modeled IGD flow exceedence in cubic feet per second..................... 1<br />
Table 1-6. Modeled lake elevation exceedence. .................................................... 1<br />
Table 1-7. Possible D<strong>is</strong>tribution of IM Water Guidelines. ................................... 1<br />
Table 2-1. Lost River sucker (LRS) and shortnose sucker (SNS) population<br />
location and status........................................................................................... 1<br />
Table 2-2. Cattle production in <strong>Klamath</strong> County, Oregon derived from U.S.<br />
Department of Commerce............................................................................... 1<br />
Table 2-3. Approximate annual timber harvest in <strong>Klamath</strong> County, Oregon in<br />
million board feet............................................................................................ 1<br />
Table 2-4. Wetlands adjacent to UKL converted to agricultural land.<br />
Approximately 8,000 acres, primarily in the Wood River watershed, were<br />
converted but are not accounted for in th<strong>is</strong> table. ........................................... 1<br />
Table 2-5. Sediment accumulation rate from UKL sediment core analys<strong>is</strong>. ......... 1<br />
Table 2-6. Summary of 2002 UKL and <strong>Klamath</strong> Straits Drain Nutrient<br />
Concentrations. ............................................................................................... 1<br />
Table 2-7. Upper <strong>Klamath</strong> <strong>Basin</strong> Nutrient Loading 2002...................................... 1<br />
Table 2-8. L<strong>is</strong>t of Lost River monitoring locations. Locations are l<strong>is</strong>ted upstream<br />
to downstream................................................................................................. 1<br />
Table 2-9. L<strong>is</strong>t of Upper <strong>Klamath</strong> <strong>Basin</strong> nonnative f<strong>is</strong>hes. Pond habitats include<br />
reservoir impoundments.................................................................................. 1<br />
Table 2-10. Reclamation actions taken in response to USFWS 2002 BO<br />
recommendations and requirements. .............................................................. 1<br />
Table 2-11. Reclamation actions taken in response to USFWS 2002 BO<br />
conservation measures. ................................................................................... 1<br />
Table 2-12. Conservation and restoration actions taken by the KWUA and<br />
irrigation d<strong>is</strong>tricts in the Upper <strong>Klamath</strong> <strong>Basin</strong>. ............................................. 1<br />
Table 2-13. Proposed end-of-month minimum lake elevations, both biological<br />
and operational, in feet above mean sea level for UKL, Oregon.................... 1<br />
Table 2-14. Percent exceedence for end-of-month elevations in<br />
UKL, Oregon. ................................................................................................ 1<br />
Table 2-15. Proposed action minimum lake elevations, for Clear Lake and Gerber<br />
reservoirs......................................................................................................... 1<br />
Table 2-16. Emergent vegetation and lake elevation relationships for endangered<br />
larval and juvenile suckers at heavily used areas including the lower<br />
Williamson River, and Tulana, and Goose Bay sites combined..................... 1<br />
xiii