School's Report 2012 National Senior Certificate (NSC) Examination
School's Report 2012 National Senior Certificate (NSC) Examination
School's Report 2012 National Senior Certificate (NSC) Examination

You also want an ePaper? Increase the reach of your titles
YUMPU automatically turns print PDFs into web optimized ePapers that Google loves.
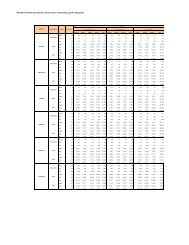
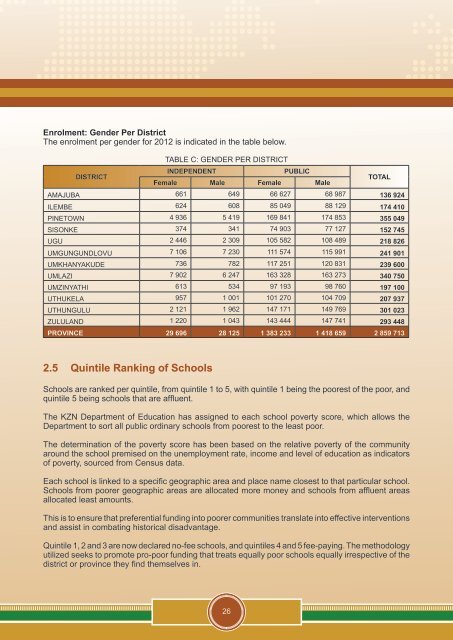
Enrolment: Gender Per District<br />
The enrolment per gender for <strong>2012</strong> is indicated in the table below.<br />
DISTRICT<br />
TABLE C: GENDER PER DISTRICT<br />
INDEPENDENT<br />
PUBLIC<br />
Female Male Female Male<br />
TOTAL<br />
AMAJUBA 661 649 66 627 68 987 136 924<br />
ILEMBE 624 608 85 049 88 129 174 410<br />
PINETOWN 4 936 5 419 169 841 174 853 355 049<br />
SISONKE 374 341 74 903 77 127 152 745<br />
UGU 2 446 2 309 105 582 108 489 218 826<br />
UMGUNGUNDLOVU 7 106 7 230 111 574 115 991 241 901<br />
UMKHANYAKUDE 736 782 117 251 120 831 239 600<br />
UMLAZI 7 902 6 247 163 328 163 273 340 750<br />
UMZINYATHI 613 534 97 193 98 760 197 100<br />
UTHUKELA 957 1 001 101 270 104 709 207 937<br />
UTHUNGULU 2 121 1 962 147 171 149 769 301 023<br />
ZULULAND 1 220 1 043 143 444 147 741 293 448<br />
PROVINCE 29 696 28 125 1 383 233 1 418 659 2 859 713<br />
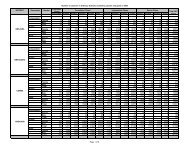
2.5 Quintile Ranking of Schools<br />
Schools are ranked per quintile, from quintile 1 to 5, with quintile 1 being the poorest of the poor, and<br />
quintile 5 being schools that are affluent.<br />
The KZN Department of Education has assigned to each school poverty score, which allows the<br />
Department to sort all public ordinary schools from poorest to the least poor.<br />
The determination of the poverty score has been based on the relative poverty of the community<br />
around the school premised on the unemployment rate, income and level of education as indicators<br />
of poverty, sourced from Census data.<br />
Each school is linked to a specific geographic area and place name closest to that particular school.<br />
Schools from poorer geographic areas are allocated more money and schools from affluent areas<br />
allocated least amounts.<br />
This is to ensure that preferential funding into poorer communities translate into effective interventions<br />
and assist in combating historical disadvantage.<br />
Quintile 1, 2 and 3 are now declared no-fee schools, and quintiles 4 and 5 fee-paying. The methodology<br />
utilized seeks to promote pro-poor funding that treats equally poor schools equally irrespective of the<br />
district or province they find themselves in.<br />
26