School's Report 2012 National Senior Certificate (NSC) Examination
School's Report 2012 National Senior Certificate (NSC) Examination
School's Report 2012 National Senior Certificate (NSC) Examination

Create successful ePaper yourself
Turn your PDF publications into a flip-book with our unique Google optimized e-Paper software.
SCHOOL’S REPORT <strong>2012</strong> NATIONAL SENIOR CERTIFICATE (<strong>NSC</strong>) EXAMINATION<br />
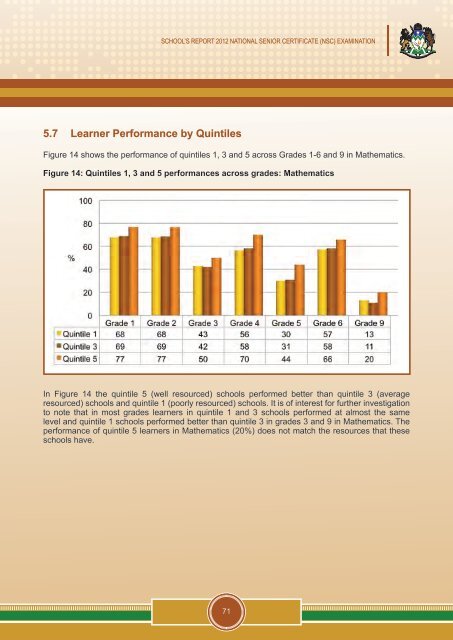
5.7 Learner Performance by Quintiles<br />
Figure 14 shows the performance of quintiles 1, 3 and 5 across Grades 1-6 and 9 in Mathematics.<br />
Figure 14: Quintiles 1, 3 and 5 performances across grades: Mathematics<br />
In Figure 14 the quintile 5 (well resourced) schools performed better than quintile 3 (average<br />
resourced) schools and quintile 1 (poorly resourced) schools. It is of interest for further investigation<br />
to note that in most grades learners in quintile 1 and 3 schools performed at almost the same<br />
level and quintile 1 schools performed better than quintile 3 in grades 3 and 9 in Mathematics. The<br />
performance of quintile 5 learners in Mathematics (20%) does not match the resources that these<br />
schools have.<br />
71