School's Report 2012 National Senior Certificate (NSC) Examination
School's Report 2012 National Senior Certificate (NSC) Examination
School's Report 2012 National Senior Certificate (NSC) Examination

Create successful ePaper yourself
Turn your PDF publications into a flip-book with our unique Google optimized e-Paper software.
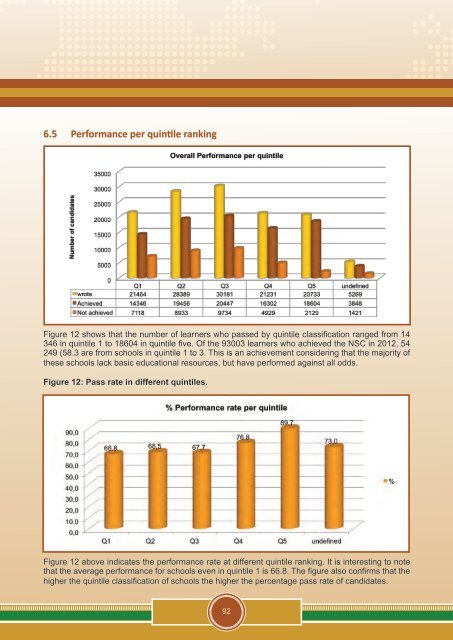
6.5 Performance per quintile ranking<br />
Figure 12 shows that the number of learners who passed by quintile classification ranged from 14<br />
346 in quintile 1 to 18604 in quintile five. Of the 93003 learners who achieved the <strong>NSC</strong> in <strong>2012</strong>, 54<br />
249 (58.3 are from schools in quintile 1 to 3. This is an achievement considering that the majority of<br />
these schools lack basic educational resources, but have performed against all odds.<br />
Figure 12: Pass rate in different quintiles.<br />
Figure 12 above indicates the performance rate at different quintile ranking. It is interesting to note<br />
that the average performance for schools even in quintile 1 is 66.8. The figure also confirms that the<br />
higher the quintile classification of schools the higher the percentage pass rate of candidates.<br />
92