School's Report 2012 National Senior Certificate (NSC) Examination
School's Report 2012 National Senior Certificate (NSC) Examination
School's Report 2012 National Senior Certificate (NSC) Examination

Create successful ePaper yourself
Turn your PDF publications into a flip-book with our unique Google optimized e-Paper software.
SCHOOL’S REPORT <strong>2012</strong> NATIONAL SENIOR CERTIFICATE (<strong>NSC</strong>) EXAMINATION<br />
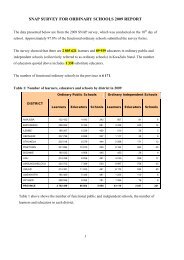
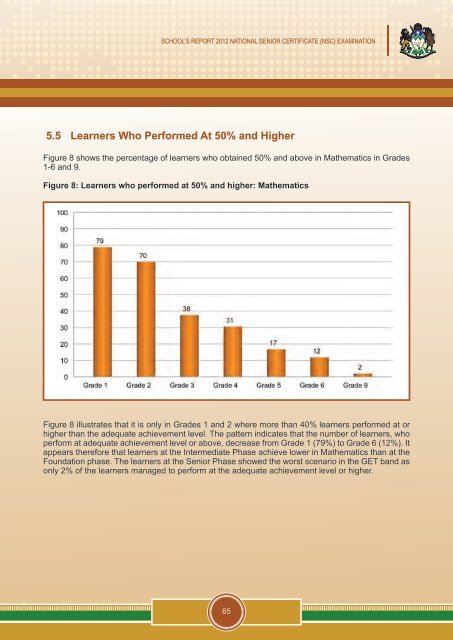
5.5 Learners Who Performed At 50% and Higher<br />
Figure 8 shows the percentage of learners who obtained 50% and above in Mathematics in Grades<br />
1-6 and 9.<br />
Figure 8: Learners who performed at 50% and higher: Mathematics<br />
Figure 8 illustrates that it is only in Grades 1 and 2 where more than 40% learners performed at or<br />
higher than the adequate achievement level. The pattern indicates that the number of learners, who<br />
perform at adequate achievement level or above, decrease from Grade 1 (79%) to Grade 6 (12%). It<br />
appears therefore that learners at the Intermediate Phase achieve lower in Mathematics than at the<br />
Foundation phase. The learners at the <strong>Senior</strong> Phase showed the worst scenario in the GET band as<br />
only 2% of the learners managed to perform at the adequate achievement level or higher.<br />
65