School's Report 2012 National Senior Certificate (NSC) Examination
School's Report 2012 National Senior Certificate (NSC) Examination
School's Report 2012 National Senior Certificate (NSC) Examination

Create successful ePaper yourself
Turn your PDF publications into a flip-book with our unique Google optimized e-Paper software.
SCHOOL’S REPORT <strong>2012</strong> NATIONAL SENIOR CERTIFICATE (<strong>NSC</strong>) EXAMINATION<br />
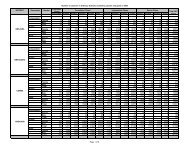
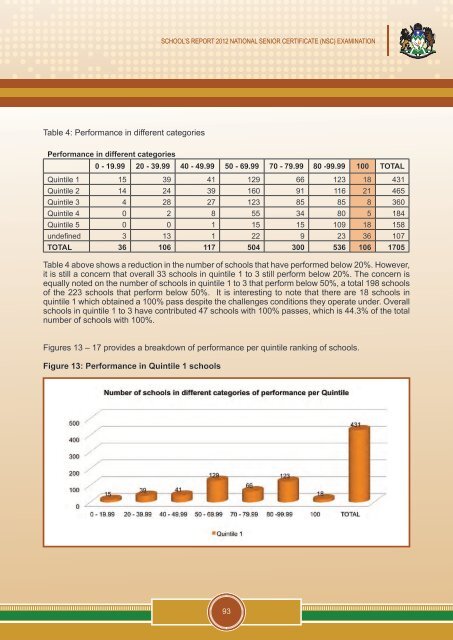
Table 4: Performance in different categories<br />
Performance in different categories<br />
0 - 19.99 20 - 39.99 40 - 49.99 50 - 69.99 70 - 79.99 80 -99.99 100 TOTAL<br />
Quintile 1 15 39 41 129 66 123 18 431<br />
Quintile 2 14 24 39 160 91 116 21 465<br />
Quintile 3 4 28 27 123 85 85 8 360<br />
Quintile 4 0 2 8 55 34 80 5 184<br />
Quintile 5 0 0 1 15 15 109 18 158<br />
undefined 3 13 1 22 9 23 36 107<br />
TOTAL 36 106 117 504 300 536 106 1705<br />
Table 4 above shows a reduction in the number of schools that have performed below 20%. However,<br />
it is still a concern that overall 33 schools in quintile 1 to 3 still perform below 20%. The concern is<br />
equally noted on the number of schools in quintile 1 to 3 that perform below 50%, a total 198 schools<br />
of the 223 schools that perform below 50%. It is interesting to note that there are 18 schools in<br />
quintile 1 which obtained a 100% pass despite the challenges conditions they operate under. Overall<br />
schools in quintile 1 to 3 have contributed 47 schools with 100% passes, which is 44.3% of the total<br />
number of schools with 100%.<br />
Figures 13 – 17 provides a breakdown of performance per quintile ranking of schools.<br />
Figure 13: Performance in Quintile 1 schools<br />
93