School's Report 2012 National Senior Certificate (NSC) Examination
School's Report 2012 National Senior Certificate (NSC) Examination
School's Report 2012 National Senior Certificate (NSC) Examination

Create successful ePaper yourself
Turn your PDF publications into a flip-book with our unique Google optimized e-Paper software.
SCHOOL’S REPORT <strong>2012</strong> NATIONAL SENIOR CERTIFICATE (<strong>NSC</strong>) EXAMINATION<br />
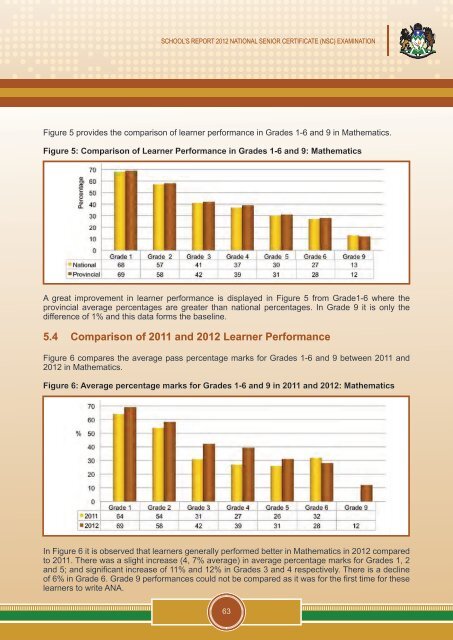
Figure 5 provides the comparison of learner performance in Grades 1-6 and 9 in Mathematics.<br />
Figure 5: Comparison of Learner Performance in Grades 1-6 and 9: Mathematics<br />
A great improvement in learner performance is displayed in Figure 5 from Grade1-6 where the<br />
provincial average percentages are greater than national percentages. In Grade 9 it is only the<br />
difference of 1% and this data forms the baseline.<br />
5.4 Comparison of 2011 and <strong>2012</strong> Learner Performance<br />
Figure 6 compares the average pass percentage marks for Grades 1-6 and 9 between 2011 and<br />
<strong>2012</strong> in Mathematics.<br />
Figure 6: Average percentage marks for Grades 1-6 and 9 in 2011 and <strong>2012</strong>: Mathematics<br />
In Figure 6 it is observed that learners generally performed better in Mathematics in <strong>2012</strong> compared<br />
to 2011. There was a slight increase (4, 7% average) in average percentage marks for Grades 1, 2<br />
and 5; and significant increase of 11% and 12% in Grades 3 and 4 respectively. There is a decline<br />
of 6% in Grade 6. Grade 9 performances could not be compared as it was for the first time for these<br />
learners to write ANA.<br />
63