- Page 1 and 2:
MINUTES OF THE REGULAR MEETING OF T
- Page 3 and 4:
July 26, 2011 Minutes of the Regula
- Page 5 and 6:
July 26, 2011 Introduction Chairman
- Page 7 and 8:
July 26, 2011 a. Approval of the Mi
- Page 9 and 10:
July 26, 2011 “Following a review
- Page 11 and 12:
July 26, 2011 3. a. Report of the P
- Page 13 and 14:
July 26, 2011 b. Report of the Chie
- Page 15 and 16:
July 26, 2011 4. Proposed Expansion
- Page 17 and 18:
July 26, 2011 average of 15.1 new j
- Page 19 and 20:
July 26, 2011 RESOLVED, That the Ch
- Page 21 and 22:
July 26, 2011 Section I Non-Complia
- Page 23 and 24:
July 26, 2011 Recommendation: Staff
- Page 25 and 26:
July 26, 2011 Niagara LaSalle Corpo
- Page 27 and 28:
July 26, 2011 The Carriage House Co
- Page 29 and 30:
July 26, 2011 RESOLVED, That the Ch
- Page 31 and 32:
July 26, 2011 commitments. Thus, cu
- Page 33 and 34:
July 26, 2011 7. Increase in Hydroe
- Page 35 and 36:
July 26, 2011 (f) Use of the RSR fo
- Page 37 and 38:
July 26, 2011 “The proposed actio
- Page 39 and 40:
July 26, 2011 RESOLVED, That the Se
- Page 41 and 42:
July 26, 2011 work, is capable of c
- Page 43 and 44:
July 26, 2011 “On May 24, 2011, n
- Page 45 and 46:
July 26, 2011 any and all actions a
- Page 47 and 48:
July 26, 2011 “The window replace
- Page 49 and 50:
July 26, 2011 11. Amended and Resta
- Page 51 and 52:
July 26, 2011 13. Amendments to the
- Page 53 and 54:
July 26, 2011 15. Motion to Conduct
- Page 55 and 56:
July 26, 2011 17. Election of Actin
- Page 57 and 58:
July 26, 2011 19. Next Meeting The
- Page 59 and 60:
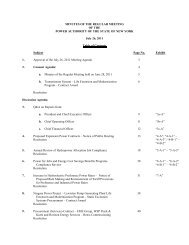
July 26, 2011 EXHIBITS For July 26,
- Page 61 and 62:
July 26, 2011- NYPA Trustees’ Mee
- Page 63 and 64:
July 26, 2011- NYPA Trustees’ Mee
- Page 65 and 66:
Exhibit “A” Economic Developmen
- Page 67 and 68:
served by the 51 municipal and coop
- Page 69 and 70:
Generation revenue in June was $176
- Page 71 and 72:
In June, NYPA finalized a position
- Page 73 and 74:
GLOSSARY 1 Net Generation - The ene
- Page 75 and 76:
as a single regional compliance mar
- Page 77 and 78:
Report of the Chief Financial Offic
- Page 79 and 80:
RESULTS OF OPERATIONS Net Income Si
- Page 81 and 82:
RESULTS OF OPERATIONS 140 120 100 8
- Page 83 and 84:
RESULTS OF OPERATIONS 180 O&M Expen
- Page 85 and 86:
CASH AND LIQUIDITY INVESTMENT PORTF
- Page 87 and 88:
DEBT Unhedged Variable Rate 12% Deb
- Page 89 and 90:
Exhibit 1: Average August to Decemb
- Page 91 and 92:
New York Power Authority Financial
- Page 93 and 94:
New York Power Authority Exhibit "4
- Page 95 and 96:
APPLICATION SUMMARY Expansion Power
- Page 97 and 98:
July 26, 2011 Exhibit “4-B-1” P
- Page 99 and 100:
WHEREAS, the Customer has completed
- Page 101 and 102:
R. Replacement Power (or RP) is 445
- Page 103 and 104:
the Service Tariff shall govern. In
- Page 105 and 106:
X. Transition of Allocation to WNY
- Page 107 and 108:
XVII. Waiver A. Any waiver at any t
- Page 109 and 110:
SCHEDULE A TO AGREEMENT FOR THE SAL
- Page 111 and 112:
United States Department of Labor (
- Page 113 and 114:
APPENDIX TO SCHEDULE B Base Employm
- Page 115 and 116: The POWER AUTHORITY OF THE STATE OF
- Page 117 and 118: D. Electric Service is the Firm Pow
- Page 119 and 120: C. The Contract Demand for the Cust
- Page 121 and 122: Charges associated with the Allocat
- Page 123 and 124: B. Except where otherwise herein sp
- Page 125 and 126: AGREED: TRY-IT DISTRIBUTING CO., IN
- Page 127 and 128: SCHEDULE B TO AGREEMENT FOR THE SAL
- Page 129 and 130: eduction of the Contract Demand to
- Page 131 and 132: July 26, 2011 Exhibit “5-A-1” C
- Page 133 and 134: July 26, 2011 Exhibit “5-A-1” C
- Page 135 and 136: July 26, 2011 Exhibit “5-A-1” C
- Page 137 and 138: July 26, 2011 Exhibit “5-A-1” C
- Page 139 and 140: July 26, 2011 Exhibit “A-2” Com
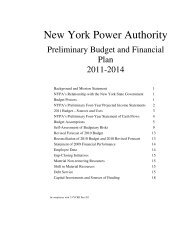
- Page 153 and 154: New York Power Authority Preliminar
- Page 155 and 156: New York Power Authority 2011 Preli
- Page 157 and 158: Discussion The attached preliminary
- Page 159 and 160: Added to the O&M for ratemaking pur
- Page 161 and 162: The capital costs (both debt- and e
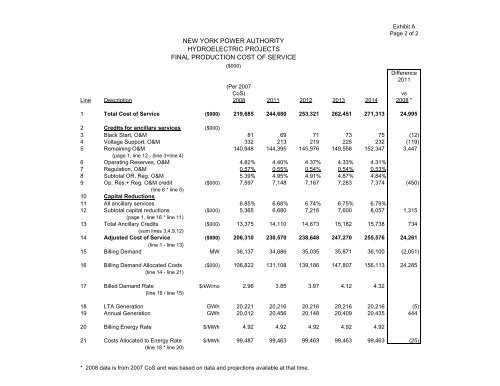
- Page 163 and 164: 2012 to 2014 costs, respectively. T
- Page 165: The proposed demand and energy rate
- Page 169 and 170: Table 1 EMBEDDED COSTS FOR ANCILLAR
- Page 171 and 172: Table 3 EMBEDDED COSTS FOR BLACK ST
- Page 173 and 174: Table 5 EMBEDDED COSTS FOR OPERATIN
- Page 175 and 176: TABLE OF CONTENTS Page ARTICLE I DE
- Page 177 and 178: “Commercial Paper Rate Mode” me
- Page 179 and 180: “Term Rate Mode” means the mode
- Page 181 and 182: Chairman, President and Chief Execu
- Page 183 and 184: Beneficial Owners to receive paymen
- Page 185 and 186: (l) any other provisions deemed adv
- Page 187 and 188: 306. Delivery of Bonds. Except as o
- Page 189 and 190: (a) The General Resolution has not
- Page 191 and 192: APPENDIX A [FORM OF BONDS] No. 2011
- Page 193 and 194: To the extent and in the manner per
- Page 195 and 196: IN WITNESS WHEREOF, POWER AUTHORITY
- Page 197 and 198: FORM OF ASSIGNMENT ASSIGNMENT FOR V
- Page 199 and 200: POWER AUTHORITY OF THE STATE OF NEW
- Page 201 and 202: Implementation of any refunding wil
- Page 203 and 204: under the Securities Exchange Act o
- Page 205 and 206: executing officer deems in his or h
- Page 207 and 208: EXHIBITS Exhibit 1: Amended and Res
- Page 209 and 210: $___,___,000 Series 2011 A Bonds SE
- Page 211 and 212: [This page intentionally left blank
- Page 213 and 214: Rate Covenant......................
- Page 215 and 216: Registration of the 2011 Bonds.....
- Page 217 and 218:
[This page intentionally left blank
- Page 219 and 220:
[This page intentionally left blank
- Page 221 and 222:
through purchased power (see ‘‘
- Page 223 and 224:
Trust Estate The Trust Estate consi
- Page 225 and 226:
and such pledge shall be subordinat
- Page 227 and 228:
Optional Redemption The 2011 Bonds
- Page 229 and 230:
casualty and life insurance compani
- Page 231 and 232:
“OID” is the excess of (i) the
- Page 233 and 234:
The specific nature of the informat
- Page 235 and 236:
[This page intentionally left blank
- Page 237 and 238:
3. The 2011 Bonds have been duly an
- Page 239 and 240:
[This page intentionally left blank
- Page 241 and 242:
4. To facilitate subsequent transfe
- Page 243 and 244:
[This page intentionally left blank
- Page 245 and 246:
circumstances, compliance with this
- Page 247 and 248:
year in which the change is made sh
- Page 249 and 250:
(vii) modifications to rights of Bo
- Page 251 and 252:
IN WITNESS WHEREOF, the parties hav
- Page 253 and 254:
APPENDIX D LITIGATION Land Claims (
- Page 255 and 256:
the costs of such pending claims, o
- Page 257 and 258:
PART 2 of the OFFICIAL STATEMENT of
- Page 259 and 260:
TABLE OF CONTENTS FOR PART 2 THE AU
- Page 261 and 262:
PART 2 of the OFFICIAL STATEMENT of
- Page 263 and 264:
CERTAIN FINANCIAL AND OPERATING MAT
- Page 265 and 266:
500-MW Plant and Cessation of Opera
- Page 267 and 268:
enefits from cash from operations.
- Page 269 and 270:
The Authority may issue additional
- Page 271 and 272:
Enterprise Risk management program,
- Page 273 and 274:
needs at any point in time. Unless
- Page 275 and 276:
NYISO Capacity Requirements Matters
- Page 277 and 278:
equirements of certain municipal el
- Page 279 and 280:
(a) Industrial Power Programs The 2
- Page 281 and 282:
withdrawn by the Authority on Augus
- Page 283 and 284:
improved energy efficiency and clea
- Page 285 and 286:
development purposes within St. Law
- Page 287 and 288:
approved to receive Awards, with to
- Page 289 and 290:
transmission facilities tariff on f
- Page 291 and 292:
THE AUTHORITY’S FACILITIES Genera
- Page 293 and 294:
eservoir, and power transformation
- Page 295 and 296:
(6) Out-of-State Power Allocations
- Page 297 and 298:
SCPPs To meet potential capacity de
- Page 299 and 300:
east from the St. Lawrence Project
- Page 301 and 302:
to predict whether any such bills o
- Page 303 and 304:
esponsibility for purchasing energy
- Page 305 and 306:
Commission in the coming months.[up
- Page 307 and 308:
could potentially result in signifi
- Page 309 and 310:
discussion does not purport to be c
- Page 311 and 312:
[This page intentionally left blank
- Page 313 and 314:
whether negotiable or non-negotiabl
- Page 315 and 316:
Operating Expenses means the Author
- Page 317 and 318:
Qualified Swap. Rating Agency means
- Page 319 and 320:
eimbursement are equal to the amort
- Page 321 and 322:
Capital Fund The General Resolution
- Page 323 and 324:
(General Resolution, Secs. 801, 802
- Page 325 and 326:
APPENDIX 2 BACKGROUNDS OF THE AUTHO
- Page 327 and 328:
Eugene L. Nicandri, Trustee Judge E
- Page 329 and 330:
Francine Evans, Executive Vice Pres
- Page 331 and 332:
Jordan Brandeis, Senior Vice Presid
- Page 333 and 334:
Exhibit “12-A” July 26, 2011 GO
- Page 335 and 336:
c. Advise the Board of Trustees on
- Page 337 and 338:
GOVERNANCE COMMITTEE CHARTER Exhibi
- Page 339 and 340:
d. Periodically review and as neces
- Page 341 and 342:
Exhibit “13-A” Editing Note: Th
- Page 343 and 344:
ARTICLE VII - FISCAL MANAGEMENT 7 S
- Page 345 and 346:
Section 2. Annual Meeting The annua
- Page 347 and 348:
as he or she may deem necessary in
- Page 349 and 350:
are carried out for and reported to
- Page 351 and 352:
and shall report on and make recomm
- Page 353 and 354:
Section 4. Capital Expenditure Plan
- Page 355 and 356:
Exhibit “13-B" July 26, 2011 BY-L
- Page 357 and 358:
ARTICLE VII - FISCAL MANAGEMENT 9 S
- Page 359 and 360:
Section 2. Annual Meeting The annua
- Page 361 and 362:
the general supervision of the busi
- Page 363 and 364:
policies of the Authority, supervis
- Page 365 and 366:
members of the Board of Trustees. A
- Page 367 and 368:
Section 5. Expenditure Authorizatio
- Page 369 and 370:
DATE: 07/26/2011 REVISION: 0 POWER
- Page 371:
DATE: 07/26/2011 REVISION: 0 POWER