

Dirac Fermions in Graphene and Graphiteâa view from angle ...
Dirac Fermions in Graphene and Graphiteâa view from angle ...
Dirac Fermions in Graphene and Graphiteâa view from angle ...

Create successful ePaper yourself
Turn your PDF publications into a flip-book with our unique Google optimized e-Paper software.
where ɛ is <strong>in</strong>f<strong>in</strong>itely small. Accord<strong>in</strong>g to Equation(2.14), the spectral function A 0 (k, E)is a delta function<br />
A 0 (k, E)=δ(E-E 0 k<br />
) for a non<strong>in</strong>teract<strong>in</strong>g system. In an <strong>in</strong>teraction system, the electron-electron correlation<br />
is expressed <strong>in</strong> terms of the electron self energy Σ(k, E)=Σ ′ (k, E)+iΣ ′′ (k, E). The real part conta<strong>in</strong>s <strong>in</strong>formation<br />
about the energy renormalization <strong>and</strong> the imag<strong>in</strong>ary part gives <strong>in</strong>formation about the lifetime of an<br />
electron with energy Ek 0 <strong>and</strong> momentum k propagat<strong>in</strong>g <strong>in</strong> the many body systems. In this case the Green’s<br />
function <strong>and</strong> the spectral function are<br />
G(k, E) =<br />
1<br />
E − E 0 k − Σ(k, E) (2.16)<br />
A(k, E) = − 1 π<br />
Σ ′′ (k, E)<br />
(E − E 0 k − Σ′ (k, E)) 2 + (Σ ′′ (k, E)) 2 (2.17)<br />
2.1.4 Energy distribution curves (EDCs) <strong>and</strong> momentum distribution curves<br />
(MDCs)<br />
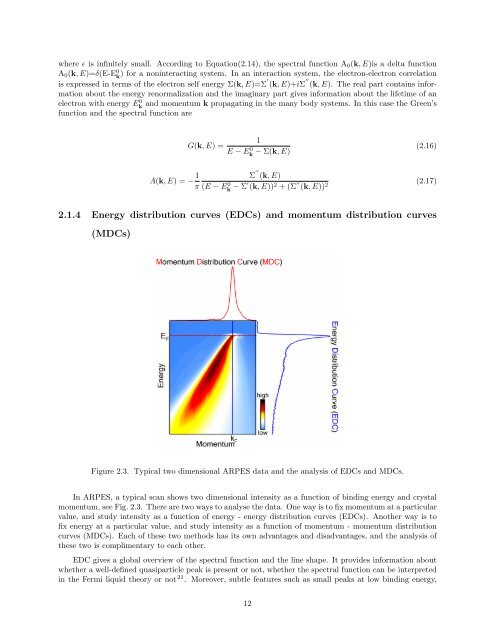
Figure 2.3. Typical two dimensional ARPES data <strong>and</strong> the analysis of EDCs <strong>and</strong> MDCs.<br />
In ARPES, a typical scan shows two dimensional <strong>in</strong>tensity as a function of b<strong>in</strong>d<strong>in</strong>g energy <strong>and</strong> crystal<br />
momentum, see Fig. 2.3. There are two ways to analyse the data. One way is to fix momentum at a particular<br />
value, <strong>and</strong> study <strong>in</strong>tensity as a function of energy - energy distribution curves (EDCs). Another way is to<br />
fix energy at a particular value, <strong>and</strong> study <strong>in</strong>tensity as a function of momentum - momentum distribution<br />
curves (MDCs). Each of these two methods has its own advantages <strong>and</strong> disadvantages, <strong>and</strong> the analysis of<br />
these two is complimentary to each other.<br />
EDC gives a global over<strong>view</strong> of the spectral function <strong>and</strong> the l<strong>in</strong>e shape. It provides <strong>in</strong>formation about<br />
whether a well-def<strong>in</strong>ed quasiparticle peak is present or not, whether the spectral function can be <strong>in</strong>terpreted<br />
<strong>in</strong> the Fermi liquid theory or not 21 . Moreover, subtle features such as small peaks at low b<strong>in</strong>d<strong>in</strong>g energy,<br />
12


