

Dirac Fermions in Graphene and Graphiteâa view from angle ...
Dirac Fermions in Graphene and Graphiteâa view from angle ...
Dirac Fermions in Graphene and Graphiteâa view from angle ...

Create successful ePaper yourself
Turn your PDF publications into a flip-book with our unique Google optimized e-Paper software.
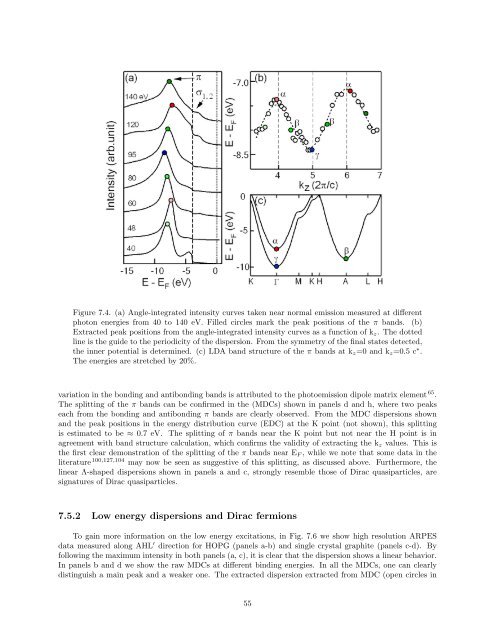
Figure 7.4. (a) Angle-<strong>in</strong>tegrated <strong>in</strong>tensity curves taken near normal emission measured at different<br />
photon energies <strong>from</strong> 40 to 140 eV. Filled circles mark the peak positions of the π b<strong>and</strong>s. (b)<br />
Extracted peak positions <strong>from</strong> the <strong>angle</strong>-<strong>in</strong>tegrated <strong>in</strong>tensity curves as a function of k z . The dotted<br />
l<strong>in</strong>e is the guide to the periodicity of the dispersion. From the symmetry of the f<strong>in</strong>al states detected,<br />
the <strong>in</strong>ner potential is determ<strong>in</strong>ed. (c) LDA b<strong>and</strong> structure of the π b<strong>and</strong>s at k z =0 <strong>and</strong> k z =0.5 c ∗ .<br />
The energies are stretched by 20%.<br />
variation <strong>in</strong> the bond<strong>in</strong>g <strong>and</strong> antibond<strong>in</strong>g b<strong>and</strong>s is attributed to the photoemission dipole matrix element 65 .<br />
The splitt<strong>in</strong>g of the π b<strong>and</strong>s can be confirmed <strong>in</strong> the (MDCs) shown <strong>in</strong> panels d <strong>and</strong> h, where two peaks<br />
each <strong>from</strong> the bond<strong>in</strong>g <strong>and</strong> antibond<strong>in</strong>g π b<strong>and</strong>s are clearly observed. From the MDC dispersions shown<br />
<strong>and</strong> the peak positions <strong>in</strong> the energy distribution curve (EDC) at the K po<strong>in</strong>t (not shown), this splitt<strong>in</strong>g<br />
is estimated to be ≈ 0.7 eV. The splitt<strong>in</strong>g of π b<strong>and</strong>s near the K po<strong>in</strong>t but not near the H po<strong>in</strong>t is <strong>in</strong><br />
agreement with b<strong>and</strong> structure calculation, which confirms the validity of extract<strong>in</strong>g the k z values. This is<br />
the first clear demonstration of the splitt<strong>in</strong>g of the π b<strong>and</strong>s near E F , while we note that some data <strong>in</strong> the<br />
literature 100,127,104 may now be seen as suggestive of this splitt<strong>in</strong>g, as discussed above. Furthermore, the<br />
l<strong>in</strong>ear Λ-shaped dispersions shown <strong>in</strong> panels a <strong>and</strong> c, strongly resemble those of <strong>Dirac</strong> quasiparticles, are<br />
signatures of <strong>Dirac</strong> quasiparticles.<br />
7.5.2 Low energy dispersions <strong>and</strong> <strong>Dirac</strong> fermions<br />
To ga<strong>in</strong> more <strong>in</strong>formation on the low energy excitations, <strong>in</strong> Fig. 7.6 we show high resolution ARPES<br />
data measured along AHL ′ direction for HOPG (panels a-b) <strong>and</strong> s<strong>in</strong>gle crystal graphite (panels c-d). By<br />
follow<strong>in</strong>g the maximum <strong>in</strong>tensity <strong>in</strong> both panels (a, c), it is clear that the dispersion shows a l<strong>in</strong>ear behavior.<br />
In panels b <strong>and</strong> d we show the raw MDCs at different b<strong>in</strong>d<strong>in</strong>g energies. In all the MDCs, one can clearly<br />
dist<strong>in</strong>guish a ma<strong>in</strong> peak <strong>and</strong> a weaker one. The extracted dispersion extracted <strong>from</strong> MDC (open circles <strong>in</strong><br />
55


