

Dirac Fermions in Graphene and Graphiteâa view from angle ...
Dirac Fermions in Graphene and Graphiteâa view from angle ...
Dirac Fermions in Graphene and Graphiteâa view from angle ...

You also want an ePaper? Increase the reach of your titles
YUMPU automatically turns print PDFs into web optimized ePapers that Google loves.
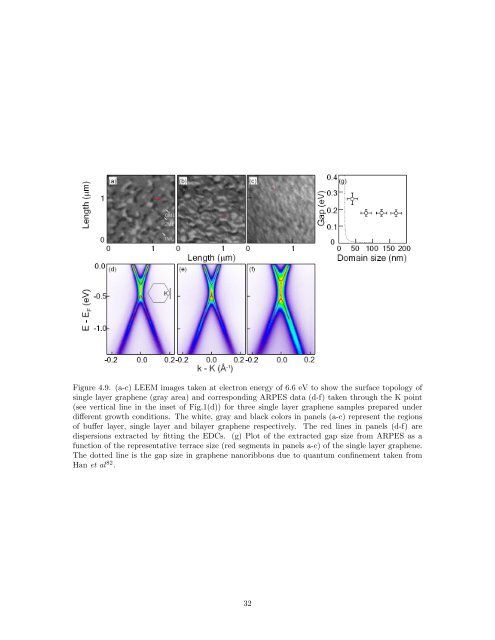
Figure 4.9. (a-c) LEEM images taken at electron energy of 6.6 eV to show the surface topology of<br />
s<strong>in</strong>gle layer graphene (gray area) <strong>and</strong> correspond<strong>in</strong>g ARPES data (d-f) taken through the K po<strong>in</strong>t<br />
(see vertical l<strong>in</strong>e <strong>in</strong> the <strong>in</strong>set of Fig.1(d)) for three s<strong>in</strong>gle layer graphene samples prepared under<br />
different growth conditions. The white, gray <strong>and</strong> black colors <strong>in</strong> panels (a-c) represent the regions<br />
of buffer layer, s<strong>in</strong>gle layer <strong>and</strong> bilayer graphene respectively. The red l<strong>in</strong>es <strong>in</strong> panels (d-f) are<br />
dispersions extracted by fitt<strong>in</strong>g the EDCs. (g) Plot of the extracted gap size <strong>from</strong> ARPES as a<br />
function of the representative terrace size (red segments <strong>in</strong> panels a-c) of the s<strong>in</strong>gle layer graphene.<br />
The dotted l<strong>in</strong>e is the gap size <strong>in</strong> graphene nanoribbons due to quantum conf<strong>in</strong>ement taken <strong>from</strong><br />
Han et al 82 .<br />
32


