

Dirac Fermions in Graphene and Graphiteâa view from angle ...
Dirac Fermions in Graphene and Graphiteâa view from angle ...
Dirac Fermions in Graphene and Graphiteâa view from angle ...

Create successful ePaper yourself
Turn your PDF publications into a flip-book with our unique Google optimized e-Paper software.
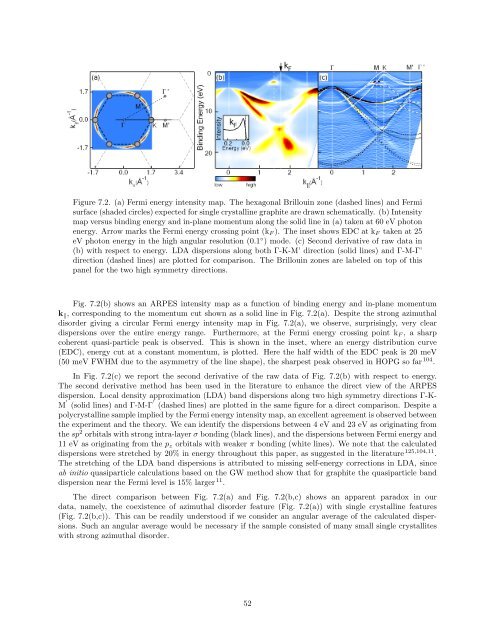
Figure 7.2. (a) Fermi energy <strong>in</strong>tensity map. The hexagonal Brillou<strong>in</strong> zone (dashed l<strong>in</strong>es) <strong>and</strong> Fermi<br />
surface (shaded circles) expected for s<strong>in</strong>gle crystall<strong>in</strong>e graphite are drawn schematically. (b) Intensity<br />
map versus b<strong>in</strong>d<strong>in</strong>g energy <strong>and</strong> <strong>in</strong>-plane momentum along the solid l<strong>in</strong>e <strong>in</strong> (a) taken at 60 eV photon<br />
energy. Arrow marks the Fermi energy cross<strong>in</strong>g po<strong>in</strong>t (k F ). The <strong>in</strong>set shows EDC at k F taken at 25<br />
eV photon energy <strong>in</strong> the high angular resolution (0.1 ◦ ) mode. (c) Second derivative of raw data <strong>in</strong><br />
(b) with respect to energy. LDA dispersions along both Γ-K-M’ direction (solid l<strong>in</strong>es) <strong>and</strong> Γ-M-Γ’<br />
direction (dashed l<strong>in</strong>es) are plotted for comparison. The Brillou<strong>in</strong> zones are labeled on top of this<br />
panel for the two high symmetry directions.<br />
Fig. 7.2(b) shows an ARPES <strong>in</strong>tensity map as a function of b<strong>in</strong>d<strong>in</strong>g energy <strong>and</strong> <strong>in</strong>-plane momentum<br />
k ‖ , correspond<strong>in</strong>g to the momentum cut shown as a solid l<strong>in</strong>e <strong>in</strong> Fig. 7.2(a). Despite the strong azimuthal<br />
disorder giv<strong>in</strong>g a circular Fermi energy <strong>in</strong>tensity map <strong>in</strong> Fig. 7.2(a), we observe, surpris<strong>in</strong>gly, very clear<br />
dispersions over the entire energy range. Furthermore, at the Fermi energy cross<strong>in</strong>g po<strong>in</strong>t k F , a sharp<br />
coherent quasi-particle peak is observed. This is shown <strong>in</strong> the <strong>in</strong>set, where an energy distribution curve<br />
(EDC), energy cut at a constant momentum, is plotted. Here the half width of the EDC peak is 20 meV<br />
(50 meV FWHM due to the asymmetry of the l<strong>in</strong>e shape), the sharpest peak observed <strong>in</strong> HOPG so far 104 .<br />
In Fig. 7.2(c) we report the second derivative of the raw data of Fig. 7.2(b) with respect to energy.<br />
The second derivative method has been used <strong>in</strong> the literature to enhance the direct <strong>view</strong> of the ARPES<br />
dispersion. Local density approximation (LDA) b<strong>and</strong> dispersions along two high symmetry directions Γ-K-<br />
M ′ (solid l<strong>in</strong>es) <strong>and</strong> Γ-M-Γ ′ (dashed l<strong>in</strong>es) are plotted <strong>in</strong> the same figure for a direct comparison. Despite a<br />
polycrystall<strong>in</strong>e sample implied by the Fermi energy <strong>in</strong>tensity map, an excellent agreement is observed between<br />
the experiment <strong>and</strong> the theory. We can identify the dispersions between 4 eV <strong>and</strong> 23 eV as orig<strong>in</strong>at<strong>in</strong>g <strong>from</strong><br />
the sp 2 orbitals with strong <strong>in</strong>tra-layer σ bond<strong>in</strong>g (black l<strong>in</strong>es), <strong>and</strong> the dispersions between Fermi energy <strong>and</strong><br />
11 eV as orig<strong>in</strong>at<strong>in</strong>g <strong>from</strong> the p z orbitals with weaker π bond<strong>in</strong>g (white l<strong>in</strong>es). We note that the calculated<br />
dispersions were stretched by 20% <strong>in</strong> energy throughout this paper, as suggested <strong>in</strong> the literature 125,104,11 .<br />
The stretch<strong>in</strong>g of the LDA b<strong>and</strong> dispersions is attributed to miss<strong>in</strong>g self-energy corrections <strong>in</strong> LDA, s<strong>in</strong>ce<br />
ab <strong>in</strong>itio quasiparticle calculations based on the GW method show that for graphite the quasiparticle b<strong>and</strong><br />
dispersion near the Fermi level is 15% larger 11 .<br />
The direct comparison between Fig. 7.2(a) <strong>and</strong> Fig. 7.2(b,c) shows an apparent paradox <strong>in</strong> our<br />
data, namely, the coexistence of azimuthal disorder feature (Fig. 7.2(a)) with s<strong>in</strong>gle crystall<strong>in</strong>e features<br />
(Fig. 7.2(b,c)). This can be readily understood if we consider an angular average of the calculated dispersions.<br />
Such an angular average would be necessary if the sample consisted of many small s<strong>in</strong>gle crystallites<br />
with strong azimuthal disorder.<br />
52


