

Dirac Fermions in Graphene and Graphiteâa view from angle ...
Dirac Fermions in Graphene and Graphiteâa view from angle ...
Dirac Fermions in Graphene and Graphiteâa view from angle ...

Create successful ePaper yourself
Turn your PDF publications into a flip-book with our unique Google optimized e-Paper software.
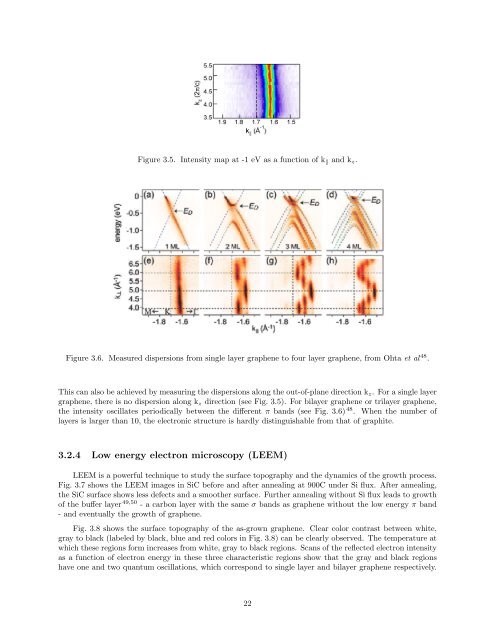
Figure 3.5. Intensity map at -1 eV as a function of k ‖ <strong>and</strong> k z .<br />
Figure 3.6. Measured dispersions <strong>from</strong> s<strong>in</strong>gle layer graphene to four layer graphene, <strong>from</strong> Ohta et al 48 .<br />
This can also be achieved by measur<strong>in</strong>g the dispersions along the out-of-plane direction k z . For a s<strong>in</strong>gle layer<br />
graphene, there is no dispersion along k z direction (see Fig. 3.5). For bilayer graphene or trilayer graphene,<br />
the <strong>in</strong>tensity oscillates periodically between the different π b<strong>and</strong>s (see Fig. 3.6) 48 . When the number of<br />
layers is larger than 10, the electronic structure is hardly dist<strong>in</strong>guishable <strong>from</strong> that of graphite.<br />
3.2.4 Low energy electron microscopy (LEEM)<br />
LEEM is a powerful technique to study the surface topography <strong>and</strong> the dynamics of the growth process.<br />
Fig. 3.7 shows the LEEM images <strong>in</strong> SiC before <strong>and</strong> after anneal<strong>in</strong>g at 900C under Si flux. After anneal<strong>in</strong>g,<br />
the SiC surface shows less defects <strong>and</strong> a smoother surface. Further anneal<strong>in</strong>g without Si flux leads to growth<br />
of the buffer layer 49,50 - a carbon layer with the same σ b<strong>and</strong>s as graphene without the low energy π b<strong>and</strong><br />
- <strong>and</strong> eventually the growth of graphene.<br />
Fig. 3.8 shows the surface topography of the as-grown graphene. Clear color contrast between white,<br />
gray to black (labeled by black, blue <strong>and</strong> red colors <strong>in</strong> Fig. 3.8) can be clearly observed. The temperature at<br />
which these regions form <strong>in</strong>creases <strong>from</strong> white, gray to black regions. Scans of the reflected electron <strong>in</strong>tensity<br />
as a function of electron energy <strong>in</strong> these three characteristic regions show that the gray <strong>and</strong> black regions<br />
have one <strong>and</strong> two quantum oscillations, which correspond to s<strong>in</strong>gle layer <strong>and</strong> bilayer graphene respectively.<br />
22


