Dirac Fermions in Graphene and Graphiteâa view from angle ...
Dirac Fermions in Graphene and Graphiteâa view from angle ...
Dirac Fermions in Graphene and Graphiteâa view from angle ...
You also want an ePaper? Increase the reach of your titles
YUMPU automatically turns print PDFs into web optimized ePapers that Google loves.
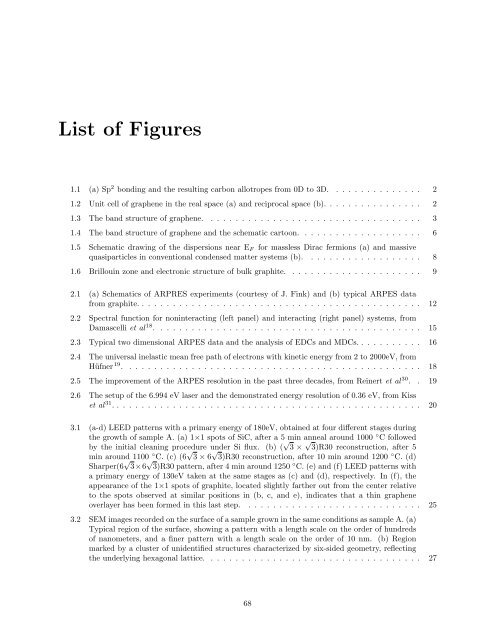
List of Figures<br />
1.1 (a) Sp 2 bond<strong>in</strong>g <strong>and</strong> the result<strong>in</strong>g carbon allotropes <strong>from</strong> 0D to 3D. . . . . . . . . . . . . . . 2<br />
1.2 Unit cell of graphene <strong>in</strong> the real space (a) <strong>and</strong> reciprocal space (b). . . . . . . . . . . . . . . . 2<br />
1.3 The b<strong>and</strong> structure of graphene. . . . . . . . . . . . . . . . . . . . . . . . . . . . . . . . . . . 3<br />
1.4 The b<strong>and</strong> structure of graphene <strong>and</strong> the schematic cartoon. . . . . . . . . . . . . . . . . . . . 6<br />
1.5 Schematic draw<strong>in</strong>g of the dispersions near E F for massless <strong>Dirac</strong> fermions (a) <strong>and</strong> massive<br />
quasiparticles <strong>in</strong> conventional condensed matter systems (b). . . . . . . . . . . . . . . . . . . 8<br />
1.6 Brillou<strong>in</strong> zone <strong>and</strong> electronic structure of bulk graphite. . . . . . . . . . . . . . . . . . . . . . 9<br />
2.1 (a) Schematics of ARPRES experiments (courtesy of J. F<strong>in</strong>k) <strong>and</strong> (b) typical ARPES data<br />
<strong>from</strong> graphite. . . . . . . . . . . . . . . . . . . . . . . . . . . . . . . . . . . . . . . . . . . . . . 12<br />
2.2 Spectral function for non<strong>in</strong>teract<strong>in</strong>g (left panel) <strong>and</strong> <strong>in</strong>teract<strong>in</strong>g (right panel) systems, <strong>from</strong><br />
Damascelli et al 18 . . . . . . . . . . . . . . . . . . . . . . . . . . . . . . . . . . . . . . . . . . . 15<br />
2.3 Typical two dimensional ARPES data <strong>and</strong> the analysis of EDCs <strong>and</strong> MDCs. . . . . . . . . . . 16<br />
2.4 The universal <strong>in</strong>elastic mean free path of electrons with k<strong>in</strong>etic energy <strong>from</strong> 2 to 2000eV, <strong>from</strong><br />
Hüfner 19 . . . . . . . . . . . . . . . . . . . . . . . . . . . . . . . . . . . . . . . . . . . . . . . . 18<br />
2.5 The improvement of the ARPES resolution <strong>in</strong> the past three decades, <strong>from</strong> Re<strong>in</strong>ert et al 30 . . 19<br />
2.6 The setup of the 6.994 eV laser <strong>and</strong> the demonstrated energy resolution of 0.36 eV, <strong>from</strong> Kiss<br />
et al 31 . . . . . . . . . . . . . . . . . . . . . . . . . . . . . . . . . . . . . . . . . . . . . . . . . . 20<br />
3.1 (a-d) LEED patterns with a primary energy of 180eV, obta<strong>in</strong>ed at four different stages dur<strong>in</strong>g<br />
the growth of sample A. (a) 1×1 spots of SiC, after a 5 m<strong>in</strong> anneal around 1000 ◦ C followed<br />
by the <strong>in</strong>itial clean<strong>in</strong>g procedure under Si flux. (b) ( √ 3 × √ 3)R30 reconstruction, after 5<br />
m<strong>in</strong> around 1100 ◦ C. (c) (6 √ 3 × 6 √ 3)R30 reconstruction, after 10 m<strong>in</strong> around 1200 ◦ C. (d)<br />
Sharper(6 √ 3×6 √ 3)R30 pattern, after 4 m<strong>in</strong> around 1250 ◦ C. (e) <strong>and</strong> (f) LEED patterns with<br />
a primary energy of 130eV taken at the same stages as (c) <strong>and</strong> (d), respectively. In (f), the<br />
appearance of the 1×1 spots of graphite, located slightly farther out <strong>from</strong> the center relative<br />
to the spots observed at similar positions <strong>in</strong> (b, c, <strong>and</strong> e), <strong>in</strong>dicates that a th<strong>in</strong> graphene<br />
overlayer has been formed <strong>in</strong> this last step. . . . . . . . . . . . . . . . . . . . . . . . . . . . . 25<br />
3.2 SEM images recorded on the surface of a sample grown <strong>in</strong> the same conditions as sample A. (a)<br />
Typical region of the surface, show<strong>in</strong>g a pattern with a length scale on the order of hundreds<br />
of nanometers, <strong>and</strong> a f<strong>in</strong>er pattern with a length scale on the order of 10 nm. (b) Region<br />
marked by a cluster of unidentified structures characterized by six-sided geometry, reflect<strong>in</strong>g<br />
the underly<strong>in</strong>g hexagonal lattice. . . . . . . . . . . . . . . . . . . . . . . . . . . . . . . . . . . 27<br />
68


