

Dirac Fermions in Graphene and Graphiteâa view from angle ...
Dirac Fermions in Graphene and Graphiteâa view from angle ...
Dirac Fermions in Graphene and Graphiteâa view from angle ...

You also want an ePaper? Increase the reach of your titles
YUMPU automatically turns print PDFs into web optimized ePapers that Google loves.
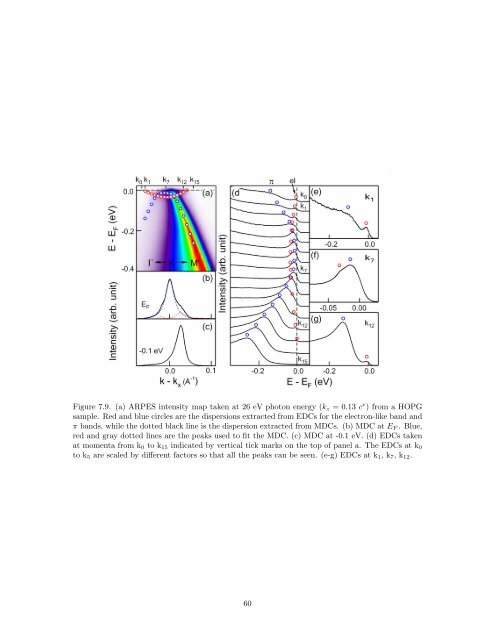
Figure 7.9. (a) ARPES <strong>in</strong>tensity map taken at 26 eV photon energy (k z = 0.13 c ∗ ) <strong>from</strong> a HOPG<br />
sample. Red <strong>and</strong> blue circles are the dispersions extracted <strong>from</strong> EDCs for the electron-like b<strong>and</strong> <strong>and</strong><br />
π b<strong>and</strong>s, while the dotted black l<strong>in</strong>e is the dispersion extracted <strong>from</strong> MDCs. (b) MDC at E F . Blue,<br />
red <strong>and</strong> gray dotted l<strong>in</strong>es are the peaks used to fit the MDC. (c) MDC at -0.1 eV. (d) EDCs taken<br />
at momenta <strong>from</strong> k 0 to k 15 <strong>in</strong>dicated by vertical tick marks on the top of panel a. The EDCs at k 0<br />
to k 5 are scaled by different factors so that all the peaks can be seen. (e-g) EDCs at k 1 , k 7 , k 12 .<br />
60


