Dirac Fermions in Graphene and Graphiteâa view from angle ...
Dirac Fermions in Graphene and Graphiteâa view from angle ...
Dirac Fermions in Graphene and Graphiteâa view from angle ...
Create successful ePaper yourself
Turn your PDF publications into a flip-book with our unique Google optimized e-Paper software.
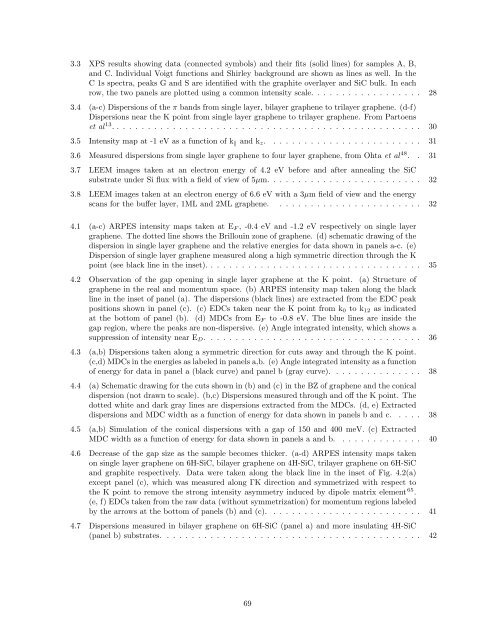
3.3 XPS results show<strong>in</strong>g data (connected symbols) <strong>and</strong> their fits (solid l<strong>in</strong>es) for samples A, B,<br />
<strong>and</strong> C. Individual Voigt functions <strong>and</strong> Shirley background are shown as l<strong>in</strong>es as well. In the<br />
C 1s spectra, peaks G <strong>and</strong> S are identified with the graphite overlayer <strong>and</strong> SiC bulk. In each<br />
row, the two panels are plotted us<strong>in</strong>g a common <strong>in</strong>tensity scale. . . . . . . . . . . . . . . . . . 28<br />
3.4 (a-c) Dispersions of the π b<strong>and</strong>s <strong>from</strong> s<strong>in</strong>gle layer, bilayer graphene to trilayer graphene. (d-f)<br />
Dispersions near the K po<strong>in</strong>t <strong>from</strong> s<strong>in</strong>gle layer graphene to trilayer graphene. From Partoens<br />
et al 13 . . . . . . . . . . . . . . . . . . . . . . . . . . . . . . . . . . . . . . . . . . . . . . . . . . 30<br />
3.5 Intensity map at -1 eV as a function of k ‖ <strong>and</strong> k z . . . . . . . . . . . . . . . . . . . . . . . . . 31<br />
3.6 Measured dispersions <strong>from</strong> s<strong>in</strong>gle layer graphene to four layer graphene, <strong>from</strong> Ohta et al 48 . . 31<br />
3.7 LEEM images taken at an electron energy of 4.2 eV before <strong>and</strong> after anneal<strong>in</strong>g the SiC<br />
substrate under Si flux with a field of <strong>view</strong> of 5µm. . . . . . . . . . . . . . . . . . . . . . . . . 32<br />
3.8 LEEM images taken at an electron energy of 6.6 eV with a 3µm field of <strong>view</strong> <strong>and</strong> the energy<br />
scans for the buffer layer, 1ML <strong>and</strong> 2ML graphene. . . . . . . . . . . . . . . . . . . . . . . . 32<br />
4.1 (a-c) ARPES <strong>in</strong>tensity maps taken at E F , -0.4 eV <strong>and</strong> -1.2 eV respectively on s<strong>in</strong>gle layer<br />
graphene. The dotted l<strong>in</strong>e shows the Brillou<strong>in</strong> zone of graphene. (d) schematic draw<strong>in</strong>g of the<br />
dispersion <strong>in</strong> s<strong>in</strong>gle layer graphene <strong>and</strong> the relative energies for data shown <strong>in</strong> panels a-c. (e)<br />
Dispersion of s<strong>in</strong>gle layer graphene measured along a high symmetric direction through the K<br />
po<strong>in</strong>t (see black l<strong>in</strong>e <strong>in</strong> the <strong>in</strong>set). . . . . . . . . . . . . . . . . . . . . . . . . . . . . . . . . . . 35<br />
4.2 Observation of the gap open<strong>in</strong>g <strong>in</strong> s<strong>in</strong>gle layer graphene at the K po<strong>in</strong>t. (a) Structure of<br />
graphene <strong>in</strong> the real <strong>and</strong> momentum space. (b) ARPES <strong>in</strong>tensity map taken along the black<br />
l<strong>in</strong>e <strong>in</strong> the <strong>in</strong>set of panel (a). The dispersions (black l<strong>in</strong>es) are extracted <strong>from</strong> the EDC peak<br />
positions shown <strong>in</strong> panel (c). (c) EDCs taken near the K po<strong>in</strong>t <strong>from</strong> k 0 to k 12 as <strong>in</strong>dicated<br />
at the bottom of panel (b). (d) MDCs <strong>from</strong> E F to -0.8 eV. The blue l<strong>in</strong>es are <strong>in</strong>side the<br />
gap region, where the peaks are non-dispersive. (e) Angle <strong>in</strong>tegrated <strong>in</strong>tensity, which shows a<br />
suppression of <strong>in</strong>tensity near E D . . . . . . . . . . . . . . . . . . . . . . . . . . . . . . . . . . . 36<br />
4.3 (a,b) Dispersions taken along a symmetric direction for cuts away <strong>and</strong> through the K po<strong>in</strong>t.<br />
(c,d) MDCs <strong>in</strong> the energies as labeled <strong>in</strong> panels a,b. (e) Angle <strong>in</strong>tegrated <strong>in</strong>tensity as a function<br />
of energy for data <strong>in</strong> panel a (black curve) <strong>and</strong> panel b (gray curve). . . . . . . . . . . . . . . 38<br />
4.4 (a) Schematic draw<strong>in</strong>g for the cuts shown <strong>in</strong> (b) <strong>and</strong> (c) <strong>in</strong> the BZ of graphene <strong>and</strong> the conical<br />
dispersion (not drawn to scale). (b,c) Dispersions measured through <strong>and</strong> off the K po<strong>in</strong>t. The<br />
dotted white <strong>and</strong> dark gray l<strong>in</strong>es are dispersions extracted <strong>from</strong> the MDCs. (d, e) Extracted<br />
dispersions <strong>and</strong> MDC width as a function of energy for data shown <strong>in</strong> panels b <strong>and</strong> c. . . . . 38<br />
4.5 (a,b) Simulation of the conical dispersions with a gap of 150 <strong>and</strong> 400 meV. (c) Extracted<br />
MDC width as a function of energy for data shown <strong>in</strong> panels a <strong>and</strong> b. . . . . . . . . . . . . . 40<br />
4.6 Decrease of the gap size as the sample becomes thicker. (a-d) ARPES <strong>in</strong>tensity maps taken<br />
on s<strong>in</strong>gle layer graphene on 6H-SiC, bilayer graphene on 4H-SiC, trilayer graphene on 6H-SiC<br />
<strong>and</strong> graphite respectively. Data were taken along the black l<strong>in</strong>e <strong>in</strong> the <strong>in</strong>set of Fig. 4.2(a)<br />
except panel (c), which was measured along ΓK direction <strong>and</strong> symmetrized with respect to<br />
the K po<strong>in</strong>t to remove the strong <strong>in</strong>tensity asymmetry <strong>in</strong>duced by dipole matrix element 65 .<br />
(e, f) EDCs taken <strong>from</strong> the raw data (without symmetrization) for momentum regions labeled<br />
by the arrows at the bottom of panels (b) <strong>and</strong> (c). . . . . . . . . . . . . . . . . . . . . . . . . 41<br />
4.7 Dispersions measured <strong>in</strong> bilayer graphene on 6H-SiC (panel a) <strong>and</strong> more <strong>in</strong>sulat<strong>in</strong>g 4H-SiC<br />
(panel b) substrates. . . . . . . . . . . . . . . . . . . . . . . . . . . . . . . . . . . . . . . . . . 42<br />
69


