Dirac Fermions in Graphene and Graphiteâa view from angle ...
Dirac Fermions in Graphene and Graphiteâa view from angle ...
Dirac Fermions in Graphene and Graphiteâa view from angle ...
Create successful ePaper yourself
Turn your PDF publications into a flip-book with our unique Google optimized e-Paper software.
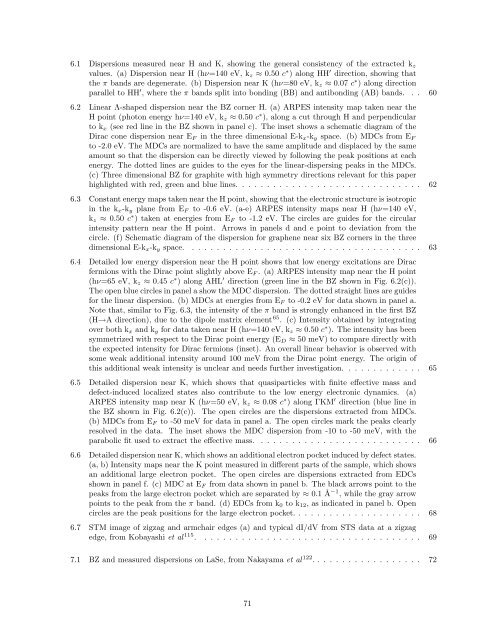
6.1 Dispersions measured near H <strong>and</strong> K, show<strong>in</strong>g the general consistency of the extracted k z<br />
values. (a) Dispersion near H (hν=140 eV, k z ≈ 0.50 c ∗ ) along HH ′ direction, show<strong>in</strong>g that<br />
the π b<strong>and</strong>s are degenerate. (b) Dispersion near K (hν=80 eV, k z ≈ 0.07 c ∗ ) along direction<br />
parallel to HH ′ , where the π b<strong>and</strong>s split <strong>in</strong>to bond<strong>in</strong>g (BB) <strong>and</strong> antibond<strong>in</strong>g (AB) b<strong>and</strong>s. . . 60<br />
6.2 L<strong>in</strong>ear Λ-shaped dispersion near the BZ corner H. (a) ARPES <strong>in</strong>tensity map taken near the<br />
H po<strong>in</strong>t (photon energy hν=140 eV, k z ≈ 0.50 c ∗ ), along a cut through H <strong>and</strong> perpendicular<br />
to k x (see red l<strong>in</strong>e <strong>in</strong> the BZ shown <strong>in</strong> panel c). The <strong>in</strong>set shows a schematic diagram of the<br />
<strong>Dirac</strong> cone dispersion near E F <strong>in</strong> the three dimensional E-k x -k y space. (b) MDCs <strong>from</strong> E F<br />
to -2.0 eV. The MDCs are normalized to have the same amplitude <strong>and</strong> displaced by the same<br />
amount so that the dispersion can be directly <strong>view</strong>ed by follow<strong>in</strong>g the peak positions at each<br />
energy. The dotted l<strong>in</strong>es are guides to the eyes for the l<strong>in</strong>ear-dispers<strong>in</strong>g peaks <strong>in</strong> the MDCs.<br />
(c) Three dimensional BZ for graphite with high symmetry directions relevant for this paper<br />
highlighted with red, green <strong>and</strong> blue l<strong>in</strong>es. . . . . . . . . . . . . . . . . . . . . . . . . . . . . . 62<br />
6.3 Constant energy maps taken near the H po<strong>in</strong>t, show<strong>in</strong>g that the electronic structure is isotropic<br />
<strong>in</strong> the k x -k y plane <strong>from</strong> E F to -0.6 eV. (a-e) ARPES <strong>in</strong>tensity maps near H (hν=140 eV,<br />
k z ≈ 0.50 c ∗ ) taken at energies <strong>from</strong> E F to -1.2 eV. The circles are guides for the circular<br />
<strong>in</strong>tensity pattern near the H po<strong>in</strong>t. Arrows <strong>in</strong> panels d <strong>and</strong> e po<strong>in</strong>t to deviation <strong>from</strong> the<br />
circle. (f) Schematic diagram of the dispersion for graphene near six BZ corners <strong>in</strong> the three<br />
dimensional E-k x -k y space. . . . . . . . . . . . . . . . . . . . . . . . . . . . . . . . . . . . . . 63<br />
6.4 Detailed low energy dispersion near the H po<strong>in</strong>t shows that low energy excitations are <strong>Dirac</strong><br />
fermions with the <strong>Dirac</strong> po<strong>in</strong>t slightly above E F . (a) ARPES <strong>in</strong>tensity map near the H po<strong>in</strong>t<br />
(hν=65 eV, k z ≈ 0.45 c ∗ ) along AHL ′ direction (green l<strong>in</strong>e <strong>in</strong> the BZ shown <strong>in</strong> Fig. 6.2(c)).<br />
The open blue circles <strong>in</strong> panel a show the MDC dispersion. The dotted straight l<strong>in</strong>es are guides<br />
for the l<strong>in</strong>ear dispersion. (b) MDCs at energies <strong>from</strong> E F to -0.2 eV for data shown <strong>in</strong> panel a.<br />
Note that, similar to Fig. 6.3, the <strong>in</strong>tensity of the π b<strong>and</strong> is strongly enhanced <strong>in</strong> the first BZ<br />
(H→A direction), due to the dipole matrix element 65 . (c) Intensity obta<strong>in</strong>ed by <strong>in</strong>tegrat<strong>in</strong>g<br />
over both k x <strong>and</strong> k y for data taken near H (hν=140 eV, k z ≈ 0.50 c ∗ ). The <strong>in</strong>tensity has been<br />
symmetrized with respect to the <strong>Dirac</strong> po<strong>in</strong>t energy (E D ≈ 50 meV) to compare directly with<br />
the expected <strong>in</strong>tensity for <strong>Dirac</strong> fermions (<strong>in</strong>set). An overall l<strong>in</strong>ear behavior is observed with<br />
some weak additional <strong>in</strong>tensity around 100 meV <strong>from</strong> the <strong>Dirac</strong> po<strong>in</strong>t energy. The orig<strong>in</strong> of<br />
this additional weak <strong>in</strong>tensity is unclear <strong>and</strong> needs further <strong>in</strong>vestigation. . . . . . . . . . . . . 65<br />
6.5 Detailed dispersion near K, which shows that quasiparticles with f<strong>in</strong>ite effective mass <strong>and</strong><br />
defect-<strong>in</strong>duced localized states also contribute to the low energy electronic dynamics. (a)<br />
ARPES <strong>in</strong>tensity map near K (hν=50 eV, k z ≈ 0.08 c ∗ ) along ΓKM ′ direction (blue l<strong>in</strong>e <strong>in</strong><br />
the BZ shown <strong>in</strong> Fig. 6.2(c)). The open circles are the dispersions extracted <strong>from</strong> MDCs.<br />
(b) MDCs <strong>from</strong> E F to -50 meV for data <strong>in</strong> panel a. The open circles mark the peaks clearly<br />
resolved <strong>in</strong> the data. The <strong>in</strong>set shows the MDC dispersion <strong>from</strong> -10 to -50 meV, with the<br />
parabolic fit used to extract the effective mass. . . . . . . . . . . . . . . . . . . . . . . . . . . 66<br />
6.6 Detailed dispersion near K, which shows an additional electron pocket <strong>in</strong>duced by defect states.<br />
(a, b) Intensity maps near the K po<strong>in</strong>t measured <strong>in</strong> different parts of the sample, which shows<br />
an additional large electron pocket. The open circles are dispersions extracted <strong>from</strong> EDCs<br />
shown <strong>in</strong> panel f. (c) MDC at E F <strong>from</strong> data shown <strong>in</strong> panel b. The black arrows po<strong>in</strong>t to the<br />
peaks <strong>from</strong> the large electron pocket which are separated by ≈ 0.1 Å −1 , while the gray arrow<br />
po<strong>in</strong>ts to the peak <strong>from</strong> the π b<strong>and</strong>. (d) EDCs <strong>from</strong> k 0 to k 12 , as <strong>in</strong>dicated <strong>in</strong> panel b. Open<br />
circles are the peak positions for the large electron pocket. . . . . . . . . . . . . . . . . . . . . 68<br />
6.7 STM image of zigzag <strong>and</strong> armchair edges (a) <strong>and</strong> typical dI/dV <strong>from</strong> STS data at a zigzag<br />
edge, <strong>from</strong> Kobayashi et al 115 . . . . . . . . . . . . . . . . . . . . . . . . . . . . . . . . . . . . 69<br />
7.1 BZ <strong>and</strong> measured dispersions on LaSe, <strong>from</strong> Nakayama et al 122 . . . . . . . . . . . . . . . . . . 72<br />
71


