

Dirac Fermions in Graphene and Graphiteâa view from angle ...
Dirac Fermions in Graphene and Graphiteâa view from angle ...
Dirac Fermions in Graphene and Graphiteâa view from angle ...

You also want an ePaper? Increase the reach of your titles
YUMPU automatically turns print PDFs into web optimized ePapers that Google loves.
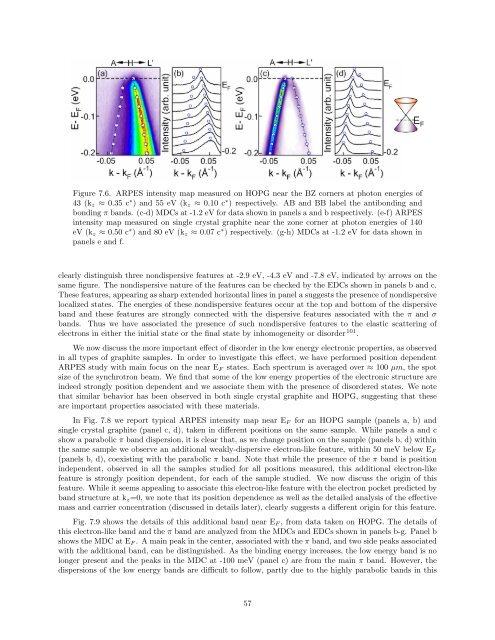
Figure 7.6. ARPES <strong>in</strong>tensity map measured on HOPG near the BZ corners at photon energies of<br />
43 (k z ≈ 0.35 c ∗ ) <strong>and</strong> 55 eV (k z ≈ 0.10 c ∗ ) respectively. AB <strong>and</strong> BB label the antibond<strong>in</strong>g <strong>and</strong><br />
bond<strong>in</strong>g π b<strong>and</strong>s. (c-d) MDCs at -1.2 eV for data shown <strong>in</strong> panels a <strong>and</strong> b respectively. (e-f) ARPES<br />
<strong>in</strong>tensity map measured on s<strong>in</strong>gle crystal graphite near the zone corner at photon energies of 140<br />
eV (k z ≈ 0.50 c ∗ ) <strong>and</strong> 80 eV (k z ≈ 0.07 c ∗ ) respectively. (g-h) MDCs at -1.2 eV for data shown <strong>in</strong><br />
panels e <strong>and</strong> f.<br />
clearly dist<strong>in</strong>guish three nondispersive features at -2.9 eV, -4.3 eV <strong>and</strong> -7.8 eV, <strong>in</strong>dicated by arrows on the<br />
same figure. The nondispersive nature of the features can be checked by the EDCs shown <strong>in</strong> panels b <strong>and</strong> c.<br />
These features, appear<strong>in</strong>g as sharp extended horizontal l<strong>in</strong>es <strong>in</strong> panel a suggests the presence of nondispersive<br />
localized states. The energies of these nondispersive features occur at the top <strong>and</strong> bottom of the dispersive<br />
b<strong>and</strong> <strong>and</strong> these features are strongly connected with the dispersive features associated with the π <strong>and</strong> σ<br />
b<strong>and</strong>s. Thus we have associated the presence of such nondispersive features to the elastic scatter<strong>in</strong>g of<br />
electrons <strong>in</strong> either the <strong>in</strong>itial state or the f<strong>in</strong>al state by <strong>in</strong>homogeneity or disorder 101 .<br />
We now discuss the more important effect of disorder <strong>in</strong> the low energy electronic properties, as observed<br />
<strong>in</strong> all types of graphite samples. In order to <strong>in</strong>vestigate this effect, we have performed position dependent<br />
ARPES study with ma<strong>in</strong> focus on the near E F states. Each spectrum is averaged over ≈ 100 µm, the spot<br />
size of the synchrotron beam. We f<strong>in</strong>d that some of the low energy properties of the electronic structure are<br />
<strong>in</strong>deed strongly position dependent <strong>and</strong> we associate them with the presence of disordered states. We note<br />
that similar behavior has been observed <strong>in</strong> both s<strong>in</strong>gle crystal graphite <strong>and</strong> HOPG, suggest<strong>in</strong>g that these<br />
are important properties associated with these materials.<br />
In Fig. 7.8 we report typical ARPES <strong>in</strong>tensity map near E F for an HOPG sample (panels a, b) <strong>and</strong><br />
s<strong>in</strong>gle crystal graphite (panel c, d), taken <strong>in</strong> different positions on the same sample. While panels a <strong>and</strong> c<br />
show a parabolic π b<strong>and</strong> dispersion, it is clear that, as we change position on the sample (panels b, d) with<strong>in</strong><br />
the same sample we observe an additional weakly-dispersive electron-like feature, with<strong>in</strong> 50 meV below E F<br />
(panels b, d), coexist<strong>in</strong>g with the parabolic π b<strong>and</strong>. Note that while the presence of the π b<strong>and</strong> is position<br />
<strong>in</strong>dependent, observed <strong>in</strong> all the samples studied for all positions measured, this additional electron-like<br />
feature is strongly position dependent, for each of the sample studied. We now discuss the orig<strong>in</strong> of this<br />
feature. While it seems appeal<strong>in</strong>g to associate this electron-like feature with the electron pocket predicted by<br />
b<strong>and</strong> structure at k z =0, we note that its position dependence as well as the detailed analysis of the effective<br />
mass <strong>and</strong> carrier concentration (discussed <strong>in</strong> details later), clearly suggests a different orig<strong>in</strong> for this feature.<br />
Fig. 7.9 shows the details of this additional b<strong>and</strong> near E F , <strong>from</strong> data taken on HOPG. The details of<br />
this electron-like b<strong>and</strong> <strong>and</strong> the π b<strong>and</strong> are analyzed <strong>from</strong> the MDCs <strong>and</strong> EDCs shown <strong>in</strong> panels b-g. Panel b<br />
shows the MDC at E F . A ma<strong>in</strong> peak <strong>in</strong> the center, associated with the π b<strong>and</strong>, <strong>and</strong> two side peaks associated<br />
with the additional b<strong>and</strong>, can be dist<strong>in</strong>guished. As the b<strong>in</strong>d<strong>in</strong>g energy <strong>in</strong>creases, the low energy b<strong>and</strong> is no<br />
longer present <strong>and</strong> the peaks <strong>in</strong> the MDC at -100 meV (panel c) are <strong>from</strong> the ma<strong>in</strong> π b<strong>and</strong>. However, the<br />
dispersions of the low energy b<strong>and</strong>s are difficult to follow, partly due to the highly parabolic b<strong>and</strong>s <strong>in</strong> this<br />
57


