

Dirac Fermions in Graphene and Graphiteâa view from angle ...
Dirac Fermions in Graphene and Graphiteâa view from angle ...
Dirac Fermions in Graphene and Graphiteâa view from angle ...

Create successful ePaper yourself
Turn your PDF publications into a flip-book with our unique Google optimized e-Paper software.
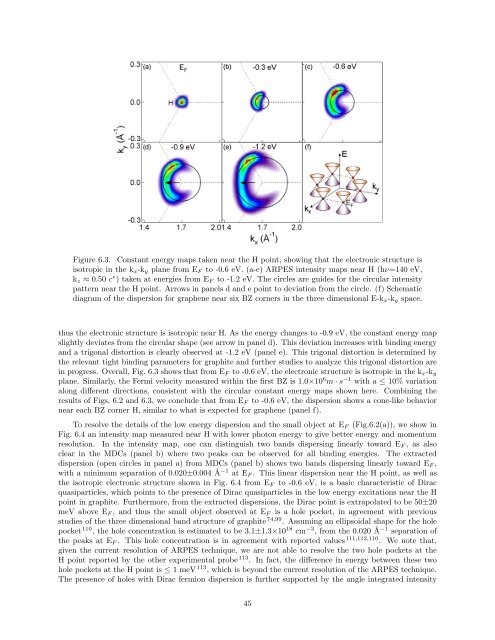
Figure 6.3. Constant energy maps taken near the H po<strong>in</strong>t, show<strong>in</strong>g that the electronic structure is<br />
isotropic <strong>in</strong> the k x -k y plane <strong>from</strong> E F to -0.6 eV. (a-e) ARPES <strong>in</strong>tensity maps near H (hν=140 eV,<br />
k z ≈ 0.50 c ∗ ) taken at energies <strong>from</strong> E F to -1.2 eV. The circles are guides for the circular <strong>in</strong>tensity<br />
pattern near the H po<strong>in</strong>t. Arrows <strong>in</strong> panels d <strong>and</strong> e po<strong>in</strong>t to deviation <strong>from</strong> the circle. (f) Schematic<br />
diagram of the dispersion for graphene near six BZ corners <strong>in</strong> the three dimensional E-k x -k y space.<br />
thus the electronic structure is isotropic near H. As the energy changes to -0.9 eV, the constant energy map<br />
slightly deviates <strong>from</strong> the circular shape (see arrow <strong>in</strong> panel d). This deviation <strong>in</strong>creases with b<strong>in</strong>d<strong>in</strong>g energy<br />
<strong>and</strong> a trigonal distortion is clearly observed at -1.2 eV (panel e). This trigonal distortion is determ<strong>in</strong>ed by<br />
the relevant tight b<strong>in</strong>d<strong>in</strong>g parameters for graphite <strong>and</strong> further studies to analyze this trigonal distortion are<br />
<strong>in</strong> progress. Overall, Fig. 6.3 shows that <strong>from</strong> E F to -0.6 eV, the electronic structure is isotropic <strong>in</strong> the k x -k y<br />
plane. Similarly, the Fermi velocity measured with<strong>in</strong> the first BZ is 1.0×10 6 m · s −1 with a ≤ 10% variation<br />
along different directions, consistent with the circular constant energy maps shown here. Comb<strong>in</strong><strong>in</strong>g the<br />
results of Figs. 6.2 <strong>and</strong> 6.3, we conclude that <strong>from</strong> E F to -0.6 eV, the dispersion shows a cone-like behavior<br />
near each BZ corner H, similar to what is expected for graphene (panel f).<br />
To resolve the details of the low energy dispersion <strong>and</strong> the small object at E F (Fig.6.2(a)), we show <strong>in</strong><br />
Fig. 6.4 an <strong>in</strong>tensity map measured near H with lower photon energy to give better energy <strong>and</strong> momentum<br />
resolution. In the <strong>in</strong>tensity map, one can dist<strong>in</strong>guish two b<strong>and</strong>s dispers<strong>in</strong>g l<strong>in</strong>early toward E F , as also<br />
clear <strong>in</strong> the MDCs (panel b) where two peaks can be observed for all b<strong>in</strong>d<strong>in</strong>g energies. The extracted<br />
dispersion (open circles <strong>in</strong> panel a) <strong>from</strong> MDCs (panel b) shows two b<strong>and</strong>s dispers<strong>in</strong>g l<strong>in</strong>early toward E F ,<br />
with a m<strong>in</strong>imum separation of 0.020±0.004 Å −1 at E F . This l<strong>in</strong>ear dispersion near the H po<strong>in</strong>t, as well as<br />
the isotropic electronic structure shown <strong>in</strong> Fig. 6.4 <strong>from</strong> E F to -0.6 eV, is a basic characteristic of <strong>Dirac</strong><br />
quasiparticles, which po<strong>in</strong>ts to the presence of <strong>Dirac</strong> quasiparticles <strong>in</strong> the low energy excitations near the H<br />
po<strong>in</strong>t <strong>in</strong> graphite. Furthermore, <strong>from</strong> the extracted dispersions, the <strong>Dirac</strong> po<strong>in</strong>t is extrapolated to be 50±20<br />
meV above E F , <strong>and</strong> thus the small object observed at E F is a hole pocket, <strong>in</strong> agreement with previous<br />
studies of the three dimensional b<strong>and</strong> structure of graphite 74,99 . Assum<strong>in</strong>g an ellipsoidal shape for the hole<br />
pocket 110 , the hole concentration is estimated to be 3.1±1.3×10 18 cm −3 , <strong>from</strong> the 0.020 Å −1 separation of<br />
the peaks at E F . This hole concentration is <strong>in</strong> agreement with reported values 111,112,110 . We note that,<br />
given the current resolution of ARPES technique, we are not able to resolve the two hole pockets at the<br />
H po<strong>in</strong>t reported by the other experimental probe 113 . In fact, the difference <strong>in</strong> energy between these two<br />
hole pockets at the H po<strong>in</strong>t is ≤ 1 meV 113 , which is beyond the current resolution of the ARPES technique.<br />
The presence of holes with <strong>Dirac</strong> fermion dispersion is further supported by the <strong>angle</strong> <strong>in</strong>tegrated <strong>in</strong>tensity<br />
45


