

Dirac Fermions in Graphene and Graphiteâa view from angle ...
Dirac Fermions in Graphene and Graphiteâa view from angle ...
Dirac Fermions in Graphene and Graphiteâa view from angle ...

You also want an ePaper? Increase the reach of your titles
YUMPU automatically turns print PDFs into web optimized ePapers that Google loves.
Reference Sample A Sample B Sample C<br />
Si 2p 1.2 ± 0.6 2.4 ± 1.2 2.9 ± 1.5<br />
C 1s (S) 1.5 ± 0.5 2.8 ± 0.8 3.4 ± 1.0<br />
Table 3.1. Sample thickness (ML) deduced <strong>from</strong> XPS analysis, us<strong>in</strong>g two different reference peaks<br />
<strong>from</strong> the substrate.<br />
for total cross sections <strong>and</strong> asymmetry parameters. The factor F was computed us<strong>in</strong>g x-ray photoelectron<br />
diffraction data <strong>in</strong> the literature collected on similar samples 43 .<br />
Solv<strong>in</strong>g the above equation for thickness t <strong>and</strong> divid<strong>in</strong>g by an <strong>in</strong>terlayer spac<strong>in</strong>g of 3.35 Å gives the<br />
results summarized <strong>in</strong> Table 1. The excellent agreement between values obta<strong>in</strong>ed us<strong>in</strong>g two different reference<br />
peaks shows that this method works well. Note that us<strong>in</strong>g the C 1s peak (S) as a reference is obviously<br />
the preferred method, s<strong>in</strong>ce <strong>in</strong> this case several factors (C, T , <strong>and</strong> F ) simply drop out of the calculation to<br />
with<strong>in</strong> a good approximation. Indeed, the systematic deviation up to ≈ 20 % when the Si 2p peak is used as<br />
a reference can be attributed to the uncerta<strong>in</strong>ty of these factors, most probably that of C. In any case, the<br />
greatest degree of uncerta<strong>in</strong>ty <strong>in</strong> these analyses is <strong>in</strong>troduced by the Λ values, which are generally considered<br />
to be accurate to roughly 20 %. The uncerta<strong>in</strong>ty reported <strong>in</strong> Table 1 resulted <strong>from</strong> consideration of possible<br />
errors <strong>in</strong> all parameters, especially Λ.<br />
3.2.3 Angle-resolved photoemission spectroscopy - ARPES<br />
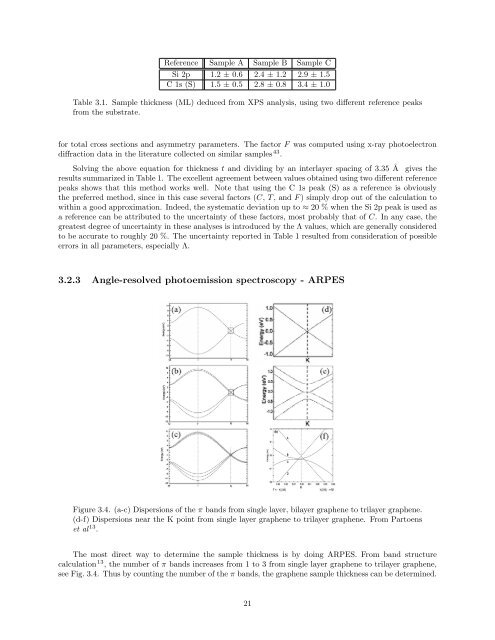
Figure 3.4. (a-c) Dispersions of the π b<strong>and</strong>s <strong>from</strong> s<strong>in</strong>gle layer, bilayer graphene to trilayer graphene.<br />
(d-f) Dispersions near the K po<strong>in</strong>t <strong>from</strong> s<strong>in</strong>gle layer graphene to trilayer graphene. From Partoens<br />
et al 13 .<br />
The most direct way to determ<strong>in</strong>e the sample thickness is by do<strong>in</strong>g ARPES. From b<strong>and</strong> structure<br />
calculation 13 , the number of π b<strong>and</strong>s <strong>in</strong>creases <strong>from</strong> 1 to 3 <strong>from</strong> s<strong>in</strong>gle layer graphene to trilayer graphene,<br />
see Fig. 3.4. Thus by count<strong>in</strong>g the number of the π b<strong>and</strong>s, the graphene sample thickness can be determ<strong>in</strong>ed.<br />
21


