

Dirac Fermions in Graphene and Graphiteâa view from angle ...
Dirac Fermions in Graphene and Graphiteâa view from angle ...
Dirac Fermions in Graphene and Graphiteâa view from angle ...

Create successful ePaper yourself
Turn your PDF publications into a flip-book with our unique Google optimized e-Paper software.
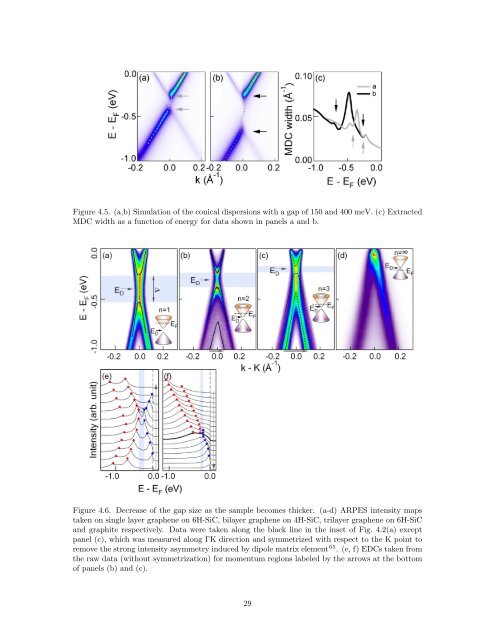
Figure 4.5. (a,b) Simulation of the conical dispersions with a gap of 150 <strong>and</strong> 400 meV. (c) Extracted<br />
MDC width as a function of energy for data shown <strong>in</strong> panels a <strong>and</strong> b.<br />
Figure 4.6. Decrease of the gap size as the sample becomes thicker. (a-d) ARPES <strong>in</strong>tensity maps<br />
taken on s<strong>in</strong>gle layer graphene on 6H-SiC, bilayer graphene on 4H-SiC, trilayer graphene on 6H-SiC<br />
<strong>and</strong> graphite respectively. Data were taken along the black l<strong>in</strong>e <strong>in</strong> the <strong>in</strong>set of Fig. 4.2(a) except<br />
panel (c), which was measured along ΓK direction <strong>and</strong> symmetrized with respect to the K po<strong>in</strong>t to<br />
remove the strong <strong>in</strong>tensity asymmetry <strong>in</strong>duced by dipole matrix element 65 . (e, f) EDCs taken <strong>from</strong><br />
the raw data (without symmetrization) for momentum regions labeled by the arrows at the bottom<br />
of panels (b) <strong>and</strong> (c).<br />
29


