Growth of Scarborough Study - Scarborough Borough Council
Growth of Scarborough Study - Scarborough Borough Council
Growth of Scarborough Study - Scarborough Borough Council

You also want an ePaper? Increase the reach of your titles
YUMPU automatically turns print PDFs into web optimized ePapers that Google loves.
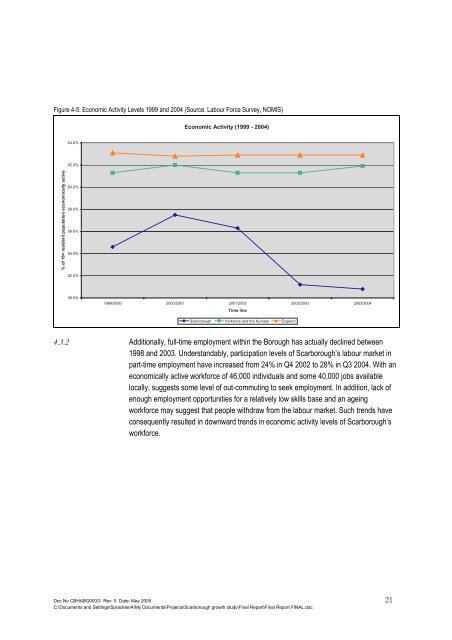
Figure 4-5: Economic Activity Levels 1999 and 2004 (Source: Labour Force Survey, NOMIS)<br />
Economic Activity (1999 - 2004)<br />
64.0%<br />
62.0%<br />
% <strong>of</strong> 16+ resident population economically active<br />
60.0%<br />
58.0%<br />
56.0%<br />
54.0%<br />
52.0%<br />
50.0%<br />
1999/2000 2000/2001 2001/2002 2002/2003 2003/2004<br />
Time line<br />
<strong>Scarborough</strong> Yorkshire and the Humber England<br />
4.3.2 Additionally, full-time employment within the <strong>Borough</strong> has actually declined between<br />
1998 and 2003. Understandably, participation levels <strong>of</strong> <strong>Scarborough</strong>’s labour market in<br />
part-time employment have increased from 24% in Q4 2002 to 28% in Q3 2004. With an<br />
economically active workforce <strong>of</strong> 46,000 individuals and some 40,000 jobs available<br />
locally, suggests some level <strong>of</strong> out-commuting to seek employment. In addition, lack <strong>of</strong><br />
enough employment opportunities for a relatively low skills base and an ageing<br />
workforce may suggest that people withdraw from the labour market. Such trends have<br />
consequently resulted in downward trends in economic activity levels <strong>of</strong> <strong>Scarborough</strong>’s<br />
workforce.<br />
Doc No CBHABG000/3 Rev: 0 Date: May 2005 21<br />
C:\Documents and Settings\SpracklenA\My Documents\Projects\<strong>Scarborough</strong> growth study\Final Report\Final Report FINAL.doc