Growth of Scarborough Study - Scarborough Borough Council
Growth of Scarborough Study - Scarborough Borough Council
Growth of Scarborough Study - Scarborough Borough Council

You also want an ePaper? Increase the reach of your titles
YUMPU automatically turns print PDFs into web optimized ePapers that Google loves.
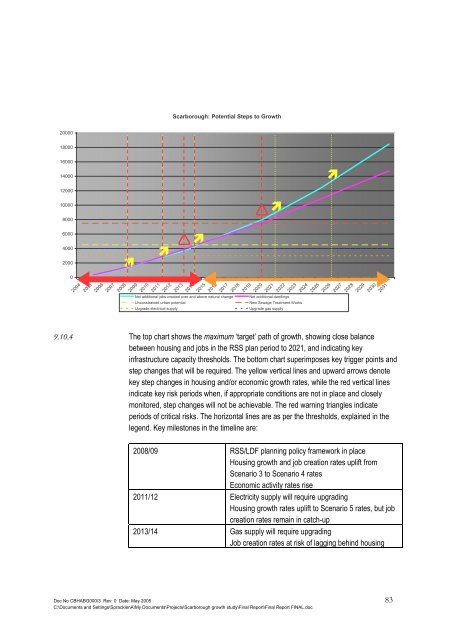
<strong>Scarborough</strong>: Potential Steps to <strong>Growth</strong><br />
20000<br />
18000<br />
16000<br />
14000<br />
<br />
12000<br />
10000<br />
8000<br />
<br />
<br />
6000<br />
4000<br />
2000<br />
<br />
<br />
0<br />
2004<br />
2005<br />
2006<br />
2007<br />
2008<br />
2009<br />
2010<br />
2011<br />
2012<br />
2013<br />
2014<br />
2015<br />
2016<br />
2017<br />
2018<br />
2019<br />
2020<br />
2021<br />
2022<br />
2023<br />
2024<br />
2025<br />
2026<br />
2027<br />
2028<br />
2029<br />
2030<br />
2031<br />
Net additional jobs created over and above natural Plan change<br />
Year (1 April Net start)<br />
additional dwellings<br />
Unconstrained urban potential<br />
New Sewage Treatment Works<br />
Upgrade electrical supply<br />
Upgrade gas supply<br />
9.10.4 The top chart shows the maximum ‘target’ path <strong>of</strong> growth, showing close balance<br />
between housing and jobs in the RSS plan period to 2021, and indicating key<br />
infrastructure capacity thresholds. The bottom chart superimposes key trigger points and<br />
step changes that will be required. The yellow vertical lines and upward arrows denote<br />
key step changes in housing and/or economic growth rates, while the red vertical lines<br />
indicate key risk periods when, if appropriate conditions are not in place and closely<br />
monitored, step changes will not be achievable. The red warning triangles indicate<br />
periods <strong>of</strong> critical risks. The horizontal lines are as per the thresholds, explained in the<br />
legend. Key milestones in the timeline are:<br />
2008/09 RSS/LDF planning policy framework in place<br />
Housing growth and job creation rates uplift from<br />
Scenario 3 to Scenario 4 rates<br />
Economic activity rates rise<br />
2011/12 Electricity supply will require upgrading<br />
Housing growth rates uplift to Scenario 5 rates, but job<br />
creation rates remain in catch-up<br />
2013/14 Gas supply will require upgrading<br />
Job creation rates at risk <strong>of</strong> lagging behind housing<br />
Doc No CBHABG000/3 Rev: 0 Date: May 2005 83<br />
C:\Documents and Settings\SpracklenA\My Documents\Projects\<strong>Scarborough</strong> growth study\Final Report\Final Report FINAL.doc