Growth of Scarborough Study - Scarborough Borough Council
Growth of Scarborough Study - Scarborough Borough Council
Growth of Scarborough Study - Scarborough Borough Council

Create successful ePaper yourself
Turn your PDF publications into a flip-book with our unique Google optimized e-Paper software.
4.6 Business base<br />
4.6.1 Driven by <strong>Scarborough</strong>’s labour market and employment pr<strong>of</strong>ile the <strong>Borough</strong>’s business<br />
stock has a very high concentration <strong>of</strong> low value-adding businesses, with almost 40% <strong>of</strong><br />
local businesses in wholesale/retail and tourism industries. Another 42% <strong>of</strong> local<br />
businesses are from sectors with low levels <strong>of</strong> employment locally. These include<br />
agriculture, construction and business services/real estate. Additionally, other key<br />
employment sectors including manufacturing, education and health account for only 7%<br />
<strong>of</strong> local business stock. On a similar note, some 14 firms in <strong>Scarborough</strong> which employ<br />
more than 200 individuals each account for as much as 15% <strong>of</strong> local employment. Such<br />
trends highlight the dependence <strong>of</strong> local economy on fewer large scale employers.<br />
Although growth <strong>of</strong> <strong>Scarborough</strong>’s business base is comparable to the regional rate, it is<br />
much lower than the national average. Additionally, <strong>Scarborough</strong> has a lower incidence<br />
<strong>of</strong> micro SMEs which have further witnessed a slower than average growth between<br />
1998 and 2003.<br />
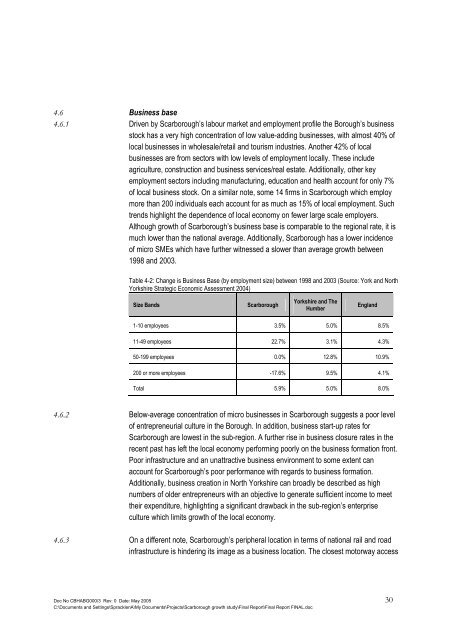
Table 4-2: Change is Business Base (by employment size) between 1998 and 2003 (Source: York and North<br />
Yorkshire Strategic Economic Assessment 2004)<br />
Size Bands<br />
<strong>Scarborough</strong><br />
Yorkshire and The<br />
Humber<br />
England<br />
1-10 employees 3.5% 5.0% 8.5%<br />
11-49 employees 22.7% 3.1% 4.3%<br />
50-199 employees 0.0% 12.8% 10.9%<br />
200 or more employees -17.6% 9.5% 4.1%<br />
Total 5.9% 5.0% 8.0%<br />
4.6.2 Below-average concentration <strong>of</strong> micro businesses in <strong>Scarborough</strong> suggests a poor level<br />
<strong>of</strong> entrepreneurial culture in the <strong>Borough</strong>. In addition, business start-up rates for<br />
<strong>Scarborough</strong> are lowest in the sub-region. A further rise in business closure rates in the<br />
recent past has left the local economy performing poorly on the business formation front.<br />
Poor infrastructure and an unattractive business environment to some extent can<br />
account for <strong>Scarborough</strong>’s poor performance with regards to business formation.<br />
Additionally, business creation in North Yorkshire can broadly be described as high<br />
numbers <strong>of</strong> older entrepreneurs with an objective to generate sufficient income to meet<br />
their expenditure, highlighting a significant drawback in the sub-region’s enterprise<br />
culture which limits growth <strong>of</strong> the local economy.<br />
4.6.3 On a different note, <strong>Scarborough</strong>’s peripheral location in terms <strong>of</strong> national rail and road<br />
infrastructure is hindering its image as a business location. The closest motorway access<br />
Doc No CBHABG000/3 Rev: 0 Date: May 2005 30<br />
C:\Documents and Settings\SpracklenA\My Documents\Projects\<strong>Scarborough</strong> growth study\Final Report\Final Report FINAL.doc