Special Issue; Products for Industrial Machinery - NTN
Special Issue; Products for Industrial Machinery - NTN
Special Issue; Products for Industrial Machinery - NTN

Create successful ePaper yourself
Turn your PDF publications into a flip-book with our unique Google optimized e-Paper software.
<strong>NTN</strong> TECHNICAL REVIEW No.742006<br />
3. Test Results and Discussion<br />
3.1 Ultrasonic fatigue test results<br />
3.1.1 SN characteristics<br />
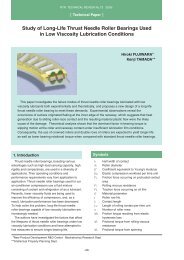
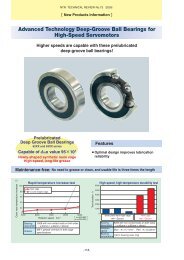
The results of the ultrasonic fatigue test are plotted<br />
graphically in Fig. 6. Compared to the results obtained<br />
without hydrogen pre-charging, the fatigue strength<br />
with hydrogen pre-charging was much lower. In<br />
addition, fatigue strength decreased with greater<br />
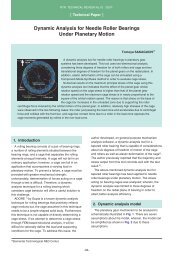
current densities. As shown in Fig. 7, the mode of<br />
fracture was a fish-eye fracture initiated at a non-metal<br />
inclusion or other impurities within each test piece<br />
regardless of whether or not they were subjected to<br />
hydrogen pre-charging. Thus, no macro-scale<br />
difference in fracture mode was found.<br />
3.1.2 Relationship between fatigue strength and<br />
diffusible hydrogen content<br />
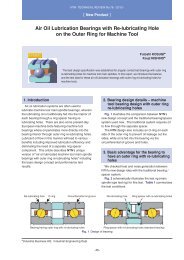
The relationship between the temperature and the<br />
hydrogen release rate were obtained from the thermal<br />
desorption analysis of hydrogen. The results are<br />
shown graphically in Fig. 8. The amount of hydrogen<br />
released was greater with greater hydrogen precharging<br />
current densities, peaking at around 80˚C.<br />
The hydrogen released at temperatures up to 200˚C<br />
Stress amplitude, MPa<br />
1400<br />
1200<br />
1000<br />
800<br />
600<br />
400<br />
1.E+04<br />
0.4mA/cm 2<br />
0.5mA/cm 2<br />
1.E+05<br />
No hydrogen pre-charging<br />
0.1mA/cm 2 0.2mA/cm 2<br />
1.E+06<br />
0.3mA/cm 2<br />
1.E+07<br />
Number of load repetitions<br />
Fig. 6 Results of ultrasonic fatigue testing<br />
1.E+08<br />
was defined as diffusible hydrogen and the amount of<br />
such hydrogen is plotted in Fig. 8.<br />
Based on the results shown in Figs. 6 and 8, the<br />
effects of diffusible hydrogen on fatigue strength of<br />
JIS-SUJ2 steel were evaluated considering the<br />
following two points.<br />
First, because scattering was present in fatigue test<br />
data, a statistical approach <strong>for</strong> handling the data was<br />
needed. Second, because premature flaking would<br />
accidentally occur on JIS-SUJ2 steel accidentally in<br />
real machines, it appeared reasonable to make the<br />
above-mentioned evaluation based on the<br />
characteristics of this material at around the fatigue<br />
limit rather than based on the high loading<br />
characteristics of this material, the latter being the<br />
evaluation practice in conventional rolling fatigued<br />
tests. Furthermore, the fatigue characteristics that can<br />
be reflected in machine designs appear to be fatigue<br />
strength-related characteristics rather than life-related<br />
characteristics. In this context, based on the JSMS-<br />
SD-6-02 SN curve regression method 6) of the Society<br />
of Materials Science, Japan, the fatigue test data was<br />
applied to a continuously-decreasing one-sided<br />
logarithmic curve model. In this way, the 50% fatigue<br />
strength curve and the 10% fatigue strength curve<br />
were determined. The curve in Fig. 9 is the 50%<br />
fatigue strength curve. The evaluation criterion was<br />
10% fatigue strength after 10 7 load application cycles.<br />
10 A NB D ABDconstants5<br />
The relationship between the amount of diffusible<br />
hydrogen and the 10% fatigue strength after 10 7 load<br />
application cycles is illustrated in Fig. 10. Since there<br />
is a good linear relation between these two factors, it<br />
could be understood that the loss in fatigue strength is<br />
governed by the diffusible hydrogen content.<br />
Hydrogen release rate, ppm/min<br />
0.25<br />
0.20<br />
0.15<br />
0.10<br />
0.05<br />
0.5mA/cm 2 6.5wt-ppm<br />
0.4mA/cm 2 5.3wt-ppm<br />
0.3mA/cm 2 4.5wt-ppm<br />
0.2mA/cm 2 3.5wt-ppm<br />
0.1mA/cm 2 2.2wt-ppm<br />
0.00<br />
0 100 200 300 400<br />
Temperature ˚C<br />
Fig. 7 Photograph of fracture center<br />
Fig. 8 Results of thermal desorption analysis of hydrogen<br />
-58-

![[New Product] Unit Products for Office Equipment - NTN](https://img.yumpu.com/27154451/1/184x260/new-product-unit-products-for-office-equipment-ntn.jpg?quality=85)
![[New Product] Development of Oil-impregnated Sintered ... - NTN](https://img.yumpu.com/27154427/1/184x260/new-product-development-of-oil-impregnated-sintered-ntn.jpg?quality=85)