Special Issue; Products for Industrial Machinery - NTN
Special Issue; Products for Industrial Machinery - NTN
Special Issue; Products for Industrial Machinery - NTN

Create successful ePaper yourself
Turn your PDF publications into a flip-book with our unique Google optimized e-Paper software.
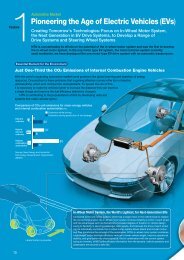
The Influence of Hydrogen on Tension-Compression and Rolling Contact Fatigue Properties of Bearing Steel<br />
Stress amplitude<br />
50<br />
10<br />
10% fatigue strength after<br />
10 7 load application cycles<br />
10 7<br />
Number of load applications<br />
1.282s<br />
Fig. 9 Estimation of 10% fatigue strength at 10 7 cycles<br />
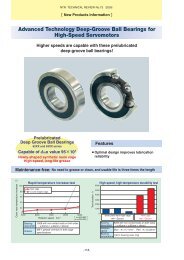
10% fatigue life after 10 7 load application cycles<br />
MPa<br />
1100<br />
1000<br />
900<br />
800<br />
700<br />
600<br />
500<br />
400<br />
300<br />
200<br />
No hydrogen pre-charging<br />
0.1mA/cm 2 0.2mA/cm 2<br />
0.3mA/cm 2<br />
0.4mA/cm 2 0.5mA/cm 2<br />
0 1 2 3 4 5 6 7<br />
Diffusible hydrogen content wt-ppm<br />
Fig. 10 Relationship between diffusible hydrogen<br />
concentration and 10% fatigue strength at 10 7 cycles<br />
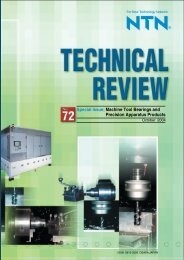
3.2 Results of roller rolling-sliding test<br />
3.2.1 Crack initiation life<br />
The relationship between the hydrogen precharging<br />
current densities and the number of rolling<br />
test runs be<strong>for</strong>e occurrence of surface cracking in the<br />
double-roller rolling-sliding test is illustrated in Fig. 11.<br />
Because the calculated life under the conditions of this<br />
test was 36,511 hours (approx. 4 years), 7),8) cracking<br />
must not occur during the effective bearing life.<br />
However, as shown in Fig. 11, in the result of each<br />
test run that underwent hydrogen pre-charging,<br />
surface cracking occurred be<strong>for</strong>e 80 hours had<br />
elapsed, which is much shorter than the calculated<br />
life. The accumulated test duration (the number of<br />
load application cycles) be<strong>for</strong>e the occurrence of<br />
cracking was shorter with greater current densities,<br />
that is, with greater amounts of penetrated hydrogen.<br />
3.2.2 Relationship between microstructural<br />
changes and diffusible hydrogen contents<br />
Photos of surface cracks and their circumferential<br />
cross sections are shown in Fig. 12. Fig. 12(a) shows<br />
the test result from a current density of 1.0 mA/cm 2<br />
and Fig. 12(b) shows the test result from a current<br />
density of 0.3 mA/cm 2 . In the case of Fig. 12(a), what<br />
is distinctive about 12(a), that is not observed in 12(b)<br />
were observed under the rolling surface. In contrast, in<br />
the case of Fig. 12(b), no distinctive microstructural<br />
changes were observed. Judging from these results, it<br />
appears that distinctive microstructural changes occur<br />
with greater amounts of penetrated hydrogen, but they<br />
do not always occur with lower amounts of penetrated<br />
hydrogen.<br />
3.2.3 Correlation between the results of the<br />
ultrasonic fatigue tests and the results of<br />
the double-roller rolling-sliding test<br />
As previously described in the introduction, with the<br />
bearing products on the market, though a very rare<br />
occurrence, surface-initiated flaking sometimes occurs<br />
on the contact surface without apparent damage. The<br />
cause of this problem could be tensile stress that is<br />
repeatedly applied circumferentially to the rolling<br />
contact surface. This tensile stress is greater with a<br />
greater rolling friction coefficient. It could be easily<br />
imagined that, under such conditions, premature<br />
flaking would tend to occur if diffusible hydrogen<br />
penetrates the material and the fatigue strength of the<br />
material deteriorates. There<strong>for</strong>e, an investigation was<br />
conducted to determine the effect of the SN<br />
Current density<br />
mA/cm 2 <br />
0.3<br />
Roller subjected<br />
to hydrogen<br />
pre-charging<br />
Driving side<br />
Following side<br />
Number of test repetitions (accumulated test duration)<br />
1 (20h) 2 (40h) 3 (60h) 4 (80h)<br />
0.5<br />
1.0<br />
Driving side<br />
Following side<br />
Driving side<br />
Following side<br />
Fig. 11 Relationship between the current density <strong>for</strong> hydrogen pre-charging and the number of repetitions to failure<br />
-59-

![[New Product] Unit Products for Office Equipment - NTN](https://img.yumpu.com/27154451/1/184x260/new-product-unit-products-for-office-equipment-ntn.jpg?quality=85)
![[New Product] Development of Oil-impregnated Sintered ... - NTN](https://img.yumpu.com/27154427/1/184x260/new-product-development-of-oil-impregnated-sintered-ntn.jpg?quality=85)