

Microsoft Word - AMICS-29Jan2013 - Childinfo.org
Microsoft Word - AMICS-29Jan2013 - Childinfo.org
Microsoft Word - AMICS-29Jan2013 - Childinfo.org

You also want an ePaper? Increase the reach of your titles
YUMPU automatically turns print PDFs into web optimized ePapers that Google loves.
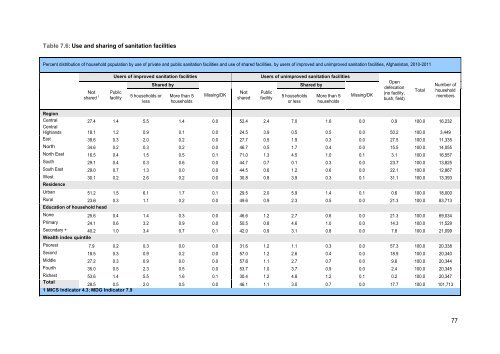
Table 7.6: Use and sharing of sanitation facilities<br />
Percent distribution of household population by use of private and public sanitation facilities and use of shared facilities, by users of improved and unimproved sanitation facilities, Afghanistan, 2010-2011<br />
Not<br />
shared 1<br />
Users of improved sanitation facilities<br />
Public<br />
facility<br />
5 households or<br />
less<br />
Shared by<br />
More than 5<br />
households<br />
Missing/DK<br />
Not<br />
shared<br />
Users of unimproved sanitation facilities<br />
Public<br />
facility<br />
5 households<br />
or less<br />
Shared by<br />
More than 5<br />
households<br />
Missing/DK<br />
Open<br />
defecation<br />
(no facility,<br />
bush, field)<br />
Total<br />
Number of<br />
household<br />
members<br />
Region<br />
Central 27.4 1.4 5.5 1.4 0.0 52.4 2.4 7.0 1.6 0.0 0.9 100.0 16,232<br />
Central<br />
Highlands 18.1 1.2 0.9 0.1 0.0 24.5 3.9 0.5 0.5 0.0 50.2 100.0 3,449<br />
East 39.6 0.3 2.0 0.2 0.0 27.7 0.5 1.9 0.3 0.0 27.5 100.0 11,335<br />
North 34.6 0.2 0.3 0.2 0.0 46.7 0.5 1.7 0.4 0.0 15.5 100.0 14,055<br />
North East 16.5 0.4 1.5 0.5 0.1 71.0 1.3 4.5 1.0 0.1 3.1 100.0 16,557<br />
South 29.1 0.4 0.3 0.6 0.0 44.7 0.7 0.1 0.3 0.0 23.7 100.0 13,825<br />
South East 29.0 0.7 1.3 0.0 0.0 44.5 0.6 1.2 0.6 0.0 22.1 100.0 12,867<br />
West 30.1 0.2 2.6 0.2 0.0 30.8 0.8 3.9 0.3 0.1 31.1 100.0 13,393<br />
Residence<br />
Urban 51.2 1.5 6.1 1.7 0.1 29.5 2.0 5.9 1.4 0.1 0.6 100.0 18,000<br />
Rural 23.6 0.3 1.1 0.2 0.0 49.6 0.9 2.3 0.5 0.0 21.3 100.0 83,713<br />
Education of household head<br />
None 25.6 0.4 1.4 0.3 0.0 46.6 1.2 2.7 0.6 0.0 21.3 100.0 69,034<br />
Primary 24.1 0.6 3.2 0.9 0.0 50.5 0.8 4.6 1.0 0.0 14.3 100.0 11,529<br />
Secondary + 40.2 1.0 3.4 0.7 0.1 42.0 0.9 3.1 0.8 0.0 7.8 100.0 21,099<br />
Wealth index quintile<br />
Poorest 7.9 0.2 0.3 0.0 0.0 31.6 1.2 1.1 0.3 0.0 57.3 100.0 20,338<br />
Second 18.5 0.3 0.9 0.2 0.0 57.0 1.2 2.6 0.4 0.0 18.9 100.0 20,340<br />
Middle 27.2 0.3 0.9 0.0 0.0 57.6 1.1 2.7 0.7 0.0 9.6 100.0 20,344<br />
Fourth 35.0 0.5 2.3 0.5 0.0 53.7 1.0 3.7 0.9 0.0 2.4 100.0 20,345<br />
Richest 53.6 1.4 5.5 1.6 0.1 30.4 1.2 4.8 1.2 0.1 0.2 100.0 20,347<br />
Total<br />
28.5 0.5 2.0 0.5 0.0 46.1 1.1 3.0 0.7 0.0 17.7 100.0 101,713<br />
1 MICS Indicator 4.3; MDG Indicator 7.9<br />
77


