Self-evaluation - Technische Universiteit Eindhoven
Self-evaluation - Technische Universiteit Eindhoven
Self-evaluation - Technische Universiteit Eindhoven

Create successful ePaper yourself
Turn your PDF publications into a flip-book with our unique Google optimized e-Paper software.
<strong>Self</strong>-<strong>evaluation</strong> research programme ESoE<br />
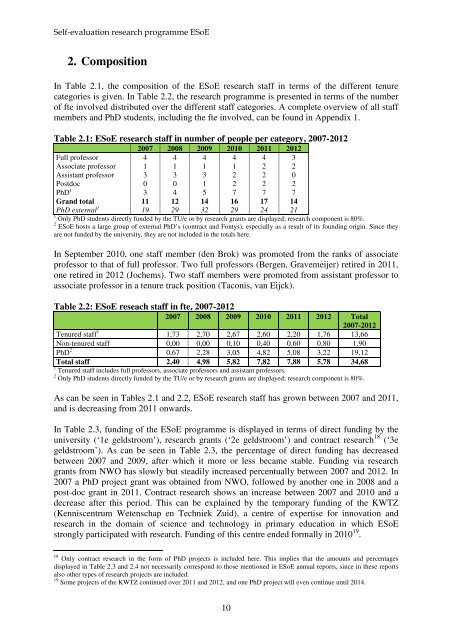
2. Composition<br />
In Table 2.1, the composition of the ESoE research staff in terms of the different tenure<br />
categories is given. In Table 2.2, the research programme is presented in terms of the number<br />
of fte involved distributed over the different staff categories. A complete overview of all staff<br />
members and PhD students, including the fte involved, can be found in Appendix 1.<br />
Table 2.1: ESoE research staff in number of people per category, 2007-2012<br />
2007 2008 2009 2010 2011 2012<br />
Full professor 4 4 4 4 4 3<br />
Associate professor 1 1 1 1 2 2<br />
Assistant professor 3 3 3 2 2 0<br />
Postdoc 0 0 1 2 2 2<br />
PhD 1 3 4 5 7 7 7<br />
Grand total 11 12 14 16 17 14<br />
PhD external 2 19 29 32 29 24 21<br />
1 Only PhD students directly funded by the TU/e or by research grants are displayed; research component is 80%.<br />
2 ESoE hosts a large group of external PhD’s (contract and Fontys), especially as a result of its founding origin. Since they<br />
are not funded by the university, they are not included in the totals here.<br />
In September 2010, one staff member (den Brok) was promoted from the ranks of associate<br />
professor to that of full professor. Two full professors (Bergen, Gravemeijer) retired in 2011,<br />
one retired in 2012 (Jochems). Two staff members were promoted from assistant professor to<br />
associate professor in a tenure track position (Taconis, van Eijck).<br />
Table 2.2: ESoE reseach staff in fte, 2007-2012<br />
2007 2008 2009 2010 2011 2012 Total<br />
2007-2012<br />
Tenured staff 1 1,73 2,70 2,67 2,60 2,20 1,76 13,66<br />
Non-tenured staff 0,00 0,00 0,10 0,40 0,60 0,80 1,90<br />
PhD 2 0,67 2,28 3,05 4,82 5,08 3,22 19,12<br />
Total staff 2,40 4,98 5,82 7,82 7,88 5,78 34,68<br />
1 Tenured staff includes full professors, associate professors and assistant professors.<br />
2 Only PhD students directly funded by the TU/e or by research grants are displayed; research component is 80%.<br />
As can be seen in Tables 2.1 and 2.2, ESoE research staff has grown between 2007 and 2011,<br />
and is decreasing from 2011 onwards.<br />
In Table 2.3, funding of the ESoE programme is displayed in terms of direct funding by the<br />
university (‘1e geldstroom’), research grants (‘2e geldstroom’) and contract research 18 (‘3e<br />
geldstroom’). As can be seen in Table 2.3, the percentage of direct funding has decreased<br />
between 2007 and 2009, after which it more or less became stable. Funding via research<br />
grants from NWO has slowly but steadily increased percentually between 2007 and 2012. In<br />
2007 a PhD project grant was obtained from NWO, followed by another one in 2008 and a<br />
post-doc grant in 2011. Contract research shows an increase between 2007 and 2010 and a<br />
decrease after this period. This can be explained by the temporary funding of the KWTZ<br />
(Kenniscentrum Wetenschap en Techniek Zuid), a centre of expertise for innovation and<br />
research in the domain of science and technology in primary education in which ESoE<br />
strongly participated with research. Funding of this centre ended formally in 2010 19 .<br />
18 Only contract research in the form of PhD projects is included here. This implies that the amounts and percentages<br />
displayed in Table 2.3 and 2.4 not necessarily correspond to those mentioned in ESoE annual reports, since in these reports<br />
also other types of research projects are included.<br />
19 Some projects of the KWTZ continued over 2011 and 2012, and one PhD project will even continue until 2014.<br />
10