2007 Annual report (PDF 8.1 Mb) - University of Melbourne
2007 Annual report (PDF 8.1 Mb) - University of Melbourne
2007 Annual report (PDF 8.1 Mb) - University of Melbourne

Create successful ePaper yourself
Turn your PDF publications into a flip-book with our unique Google optimized e-Paper software.
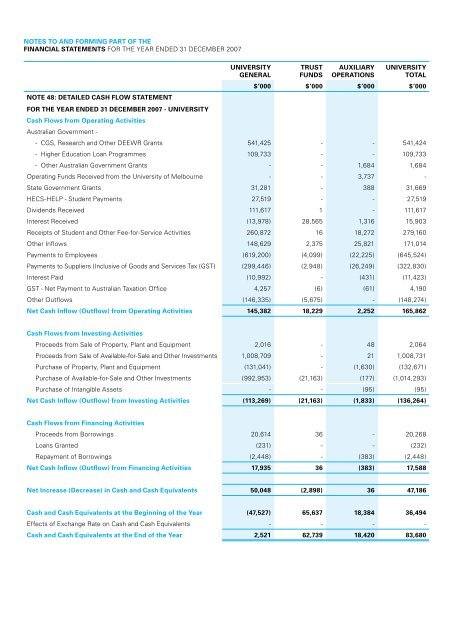
NOTES TO AND FORMING PART OF THE<br />
FINANCIAL STATEMENTS FOR THE YEAR ENDED 31 DECEMBER <strong>2007</strong><br />
UNIVERSITY<br />
GENERAL<br />
TRUST<br />
FUNDS<br />
AUXILIARY<br />
OPERATIONS<br />
UNIVERSITY<br />
TOTAL<br />
$’000 $’000 $’000 $’000<br />
NOTE 48: DETAILED CASH FLOW STATEMENT<br />
FOR THE YEAR ENDED 31 DECEMBER <strong>2007</strong> - UNIVERSITY<br />
Cash Flows from Operating Activities<br />
Australian Government -<br />
- CGS, Research and Other DEEWR Grants 541,425 - - 541,424<br />
- Higher Education Loan Programmes 109,733 - - 109,733<br />
- Other Australian Government Grants - - 1,684 1,684<br />
Operating Funds Received from the <strong>University</strong> <strong>of</strong> <strong>Melbourne</strong> - - 3,737 -<br />
State Government Grants 31,281 - 388 31,669<br />
HECS-HELP - Student Payments 27,519 - - 27,519<br />
Dividends Received 111,617 1 - 111,617<br />
Interest Received (13,978) 28,565 1,316 15,903<br />
Receipts <strong>of</strong> Student and Other Fee-for-Service Activities 260,872 16 18,272 279,160<br />
Other Inflows 148,629 2,375 25,821 171,014<br />
Payments to Employees (619,200) (4,099) (22,225) (645,524)<br />
Payments to Suppliers (Inclusive <strong>of</strong> Goods and Services Tax (GST) (299,446) (2,948) (26,249) (322,830)<br />
Interest Paid (10,992) - (431) (11,423)<br />
GST - Net Payment to Australian Taxation Office 4,257 (6) (61) 4,190<br />
Other Outflows (146,335) (5,675) - (148,274)<br />
Net Cash Inflow (Outflow) from Operating Activities 145,382 18,229 2,252 165,862<br />
Cash Flows from Investing Activities<br />
Proceeds from Sale <strong>of</strong> Property, Plant and Equipment 2,016 - 48 2,064<br />
Proceeds from Sale <strong>of</strong> Available-for-Sale and Other Investments 1,008,709 - 21 1,008,731<br />
Purchase <strong>of</strong> Property, Plant and Equipment (131,041) - (1,630) (132,671)<br />
Purchase <strong>of</strong> Available-for-Sale and Other Investments (992,953) (21,163) (177) (1,014,293)<br />
Purchase <strong>of</strong> Intangible Assets - - (95) (95)<br />
Net Cash Inflow (Outflow) from Investing Activities (113,269) (21,163) (1,833) (136,264)<br />
Cash Flows from Financing Activities<br />
Proceeds from Borrowings 20,614 36 - 20,268<br />
Loans Granted (231) - - (232)<br />
Repayment <strong>of</strong> Borrowings (2,448) - (383) (2,448)<br />
Net Cash Inflow (Outflow) from Financing Activities 17,935 36 (383) 17,588<br />
Net Increase (Decrease) in Cash and Cash Equivalents 50,048 (2,898) 36 47,186<br />
Cash and Cash Equivalents at the Beginning <strong>of</strong> the Year (47,527) 65,637 18,384 36,494<br />
Effects <strong>of</strong> Exchange Rate on Cash and Cash Equivalents - - - -<br />
Cash and Cash Equivalents at the End <strong>of</strong> the Year 2,521 62,739 18,420 83,680