

The Ecology of Tijuana Estuary, California: An Estuarine Profile
The Ecology of Tijuana Estuary, California: An Estuarine Profile
The Ecology of Tijuana Estuary, California: An Estuarine Profile

You also want an ePaper? Increase the reach of your titles
YUMPU automatically turns print PDFs into web optimized ePapers that Google loves.
GABLES<br />
Number<br />
1<br />
2<br />
3<br />
4<br />
5<br />
6<br />
7<br />
8<br />
9<br />
10<br />
11<br />
12<br />
13<br />
14<br />
15<br />
16<br />
17<br />
18<br />
19<br />
2 0<br />
2 1<br />
2 2<br />
23<br />
24<br />
2 5<br />
26<br />
2 7<br />
28<br />
29<br />
3 0<br />
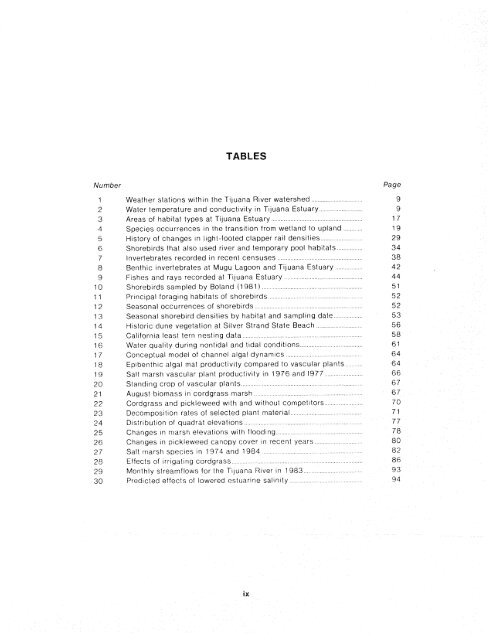
Weather stations within the <strong>Tijuana</strong> River watershed ..............................<br />
Water temperature and conductivity in <strong>Tijuana</strong> <strong>Estuary</strong> ..........................<br />
Areas <strong>of</strong> habitat types at <strong>Tijuana</strong> <strong>Estuary</strong> .......................................................<br />
Species occurrences in the transition from wetland to upland ...........<br />
ilistory <strong>of</strong> changes In light-footed clapper rail densities .........................<br />
Shorebirds that also used river and temporary pool habitats ................<br />
Invertebrates recorded in recent censuses ...................................................<br />
Benthic invertebrates at Mugu Lagoon and <strong>Tijuana</strong> <strong>Estuary</strong> ................<br />
Fishes and rays recorded at <strong>Tijuana</strong> <strong>Estuary</strong> ...........................................<br />
Shorebirds sampled by Boland (1981)......................................................<br />
Principal foraging habitats <strong>of</strong> shorebirds .................................................<br />
Seasonal occurrences <strong>of</strong> shorebirds ..............................................................<br />
Seasonal shorebird densities by habitat and sarnplir~g date .................<br />
Historic dune vegetation at Silver Strand State Beach .............................<br />
<strong>California</strong> least tern nesting data ..................................................................<br />
Water quality during nontidal and tidal conditions ......................................<br />
Conceptual model <strong>of</strong> channel algal dynamics .........................................<br />
Ep~benthic algal mat productivity compared to vascular plants .......<br />
Salt marsh vascular plant productivity in 1976 and 1977 ......................<br />
Standing crop <strong>of</strong> vascular plants ...................................................................<br />
August biomass in cordgrass marsh .................................................<br />
Cordgrass and pickleweed with and without compet~tors ......................<br />
Decomposition rates <strong>of</strong> selected plant material .......................................<br />
Distribution <strong>of</strong> quadrat elevations ....................................................<br />
Changes In rnarsh elevations with flood~ng .............................................<br />
Changes in p~ckleweed canopy cover In recent years .........................<br />
Salt rnarsh species in 1974 and 1984 ................................<br />
Effects <strong>of</strong> irrigating cordgrass ....................................................<br />
Monthly streamflows for the <strong>Tijuana</strong> River in 1983 ..........................<br />
Predicted effects <strong>of</strong> lowered estuarine salinity .............................<br />
Page


