

The Ecology of Tijuana Estuary, California: An Estuarine Profile
The Ecology of Tijuana Estuary, California: An Estuarine Profile
The Ecology of Tijuana Estuary, California: An Estuarine Profile

You also want an ePaper? Increase the reach of your titles
YUMPU automatically turns print PDFs into web optimized ePapers that Google loves.
and height were lower than ever before recorded.<br />
<strong>The</strong> delayed reaction <strong>of</strong> cordgrass tsl<br />
measurements was due to the longevity <strong>of</strong> the<br />
plant. Individual stems live 1.5-2.0 years, and the<br />
1984 measurements included stems with some live<br />
materlal from the previous growing season. By<br />
1985, there were few plants from the previous year<br />
and few individuals from 1985, even though tidal<br />
flushing had been reinstated throughout the entire<br />
growing season.<br />
To interpret these variations in cordgrass<br />
growth requires consideration <strong>of</strong> the effects <strong>of</strong><br />
hydrological change on pickleweed, because<br />
pickleweed is the competitive dominant (Zedler<br />
1982; Covin 1984) and its distribution overlaps<br />
with cordgrass throughout most <strong>of</strong> the lower marsh.<br />
Years <strong>of</strong> high pickleweed cover were 1979, 1981,<br />
and 1984-85 (Table 26). <strong>The</strong>se same years had<br />
low cordgrass biomass. Cordgrass tsl can be high<br />
when two conditions are met. First, there must be<br />
appropriate salinity, nutrients, and soil moisture;<br />
and second, there must be reduced competition<br />
from pickleweed. <strong>The</strong> latter condition appears to<br />
be associated with reduced drainage, that is.<br />
increased inundation. Several experimental tests<br />
<strong>of</strong> these hypotheses have been initiated.<br />
5.4.1 Hydrology and Salinity Experiments<br />
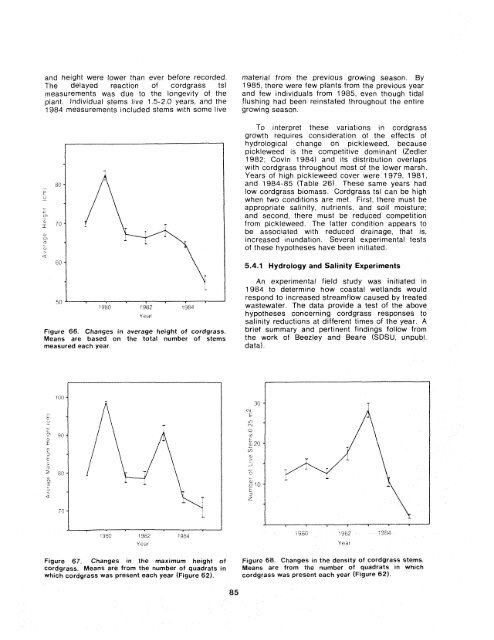
Figure 66. Changes in average height <strong>of</strong> cordgrass.<br />
Means are based on the total number <strong>of</strong> stems<br />
measured each year.<br />
<strong>An</strong> experimental field study was initiated in<br />
1984 to determine how coastal wetlands would<br />
respond to increased streamflow caused by treated<br />
wastewater. <strong>The</strong> data provide a test <strong>of</strong> the above<br />
hypotheses concerning cordgrass responses to<br />
salinity reductions at different times <strong>of</strong> the year. A<br />
brief summary and pertinent findings follow from<br />
the work <strong>of</strong> Beezley and Beare (SDSU, unpubl<br />
data).<br />
,,.,.-<br />
. r.,ir)<br />
3 7av I :?(>L ? '384<br />
Year<br />
Figure 67. Changes in the maximurn height <strong>of</strong> Figure 68. Changes in the density <strong>of</strong> cordgrass stems.<br />
cordgrass. Means are from the number <strong>of</strong> quadrats in Means are from the number <strong>of</strong> quadrats in which<br />
which cordgrass was present each year (Figure 621. cordgrass was present each year (Figure 62).


