

The Ecology of Tijuana Estuary, California: An Estuarine Profile
The Ecology of Tijuana Estuary, California: An Estuarine Profile
The Ecology of Tijuana Estuary, California: An Estuarine Profile

Create successful ePaper yourself
Turn your PDF publications into a flip-book with our unique Google optimized e-Paper software.
also limitrng Hot, dry desert winds can be<br />
devastatrng, especraily when they co~nc~de with low<br />
t~de. it is a cltmate wtth many extremes; some<br />
years and decades have little rarnfall and run<strong>of</strong>f,<br />
other years have winter storms that cause<br />
tremendous floods However, precrpltation data<br />
ind~cate that storms are always <strong>of</strong> brief durat~on<br />
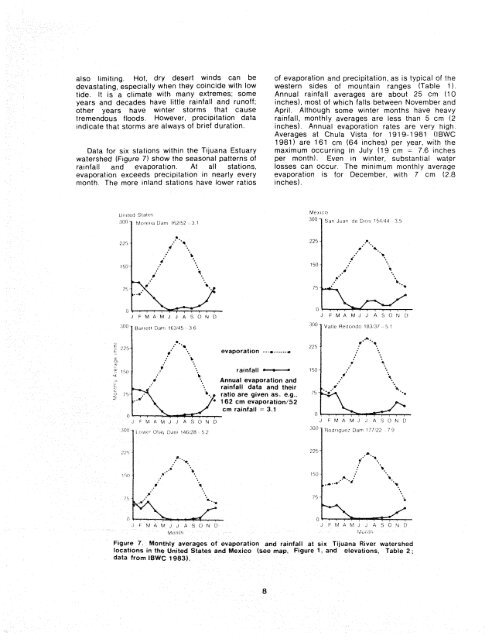
Data for srx stations wlthin the <strong>Tijuana</strong> <strong>Estuary</strong><br />
watershed (F~gure 7) show the seasonal patterns <strong>of</strong><br />
ratnfall and evaporat~on At all stations,<br />
evaporat~on exceeds precip~tat~on in nearly every<br />
month <strong>The</strong> more Inland staf~ons have lower ratios<br />
<strong>of</strong> evaporation and precipitaiion, as is typical <strong>of</strong> the<br />
western sides <strong>of</strong> mountain ranges (Table 1).<br />
<strong>An</strong>nual rainfall averages are about 25 cm (10<br />
inches), most <strong>of</strong> which falls between November and<br />
April. Although some winter months have heavy<br />
rainfall, monthly averages are less than 5 cm (2<br />
inches). <strong>An</strong>nual evaporation rates are very high.<br />
Averages at Chula Vista for 1919-1981 (IBWC<br />
1981 ) are 161 cm (64 inches) per year, with the<br />
maximum occurring in July (1 9 cm - 7.6 inches<br />
per month). Even in winter, substantial water<br />
losses can occur. <strong>The</strong> minimum monthly average<br />
evaporation is for December, with 7 cm (2.8<br />
inches).


