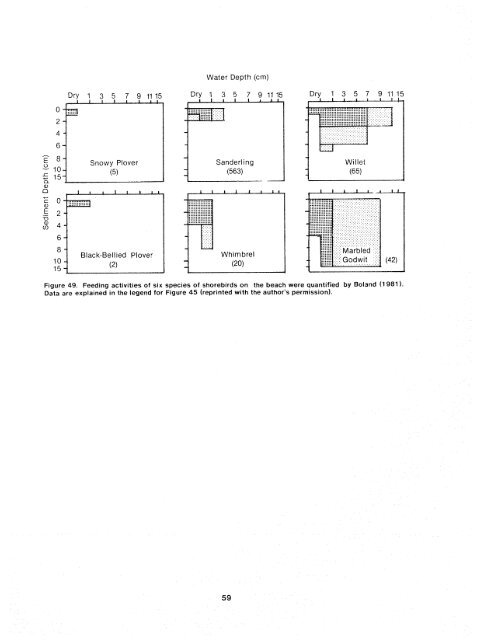
Water Depth (cm) 10 15 Black-Bellied Plove: Figure 49. Feeding activities <strong>of</strong> six species <strong>of</strong> shorebirds on the beach were quantified by Boland (1 981 ). Data are explained in the legend for Figure 45 (reprinted with the author's permission).
CHAPTER 4 ECOSYSTEM FldNCTlONlNG Studies <strong>of</strong> energy flow and nutrient cycling at <strong>Tijuana</strong> <strong>Estuary</strong> began with the salt marsh in 1976, when researchers began to test the "East Coast dogma" about coastal wetlands Research on the extensive coastal plain marshes In Georgia and elsewhere had indicated extremely high rates <strong>of</strong> vascular plant productivity, which in turn subsidized coastal food chains <strong>The</strong> early work in southern <strong>California</strong> indrcated that salt marshes were indeed different, with rates <strong>of</strong> primary productivity lower for vascular plants and hlgher for eptbenthic algae underneath the open canopy (Sect~ons 4.2-4 3). No functronal models <strong>of</strong> the ecosystem were developed, because the system siinpiy was not stable long enough for energy flow rates to be characterized. Later work focused on short-term growth rates in response to varrations in specific envlronmental factors. For example, studies <strong>of</strong> the algal growth in channels were initfated in 1984, when problems <strong>of</strong> sewage sp~lls and threats <strong>of</strong> year-round wastewater discharges indicated the need to understand what trrggers nursance algal blooms. Our ability to characterize ecosystern functioning has thus been limited by variability On the other hand, our understanding <strong>of</strong> specles composition (Chapter 5) has been aided by wltnesslng responses to the same env~ronmental tluctuations suspended in the water column, whether derived from the channel sediments or always planktonic (free-floating). Chlorophyll concentrat~ons and cell counts, rather than changes in productlv~ty rates, have been used to measure responses to nutrlent Influxes Maxrmum concentrations <strong>of</strong> chlorophyll In the plankton occurred durlng the 1984 nontldal ep~sode, when Fong documented a bloom <strong>of</strong> unicellular blue-greens (Table 16) On the other hand, rnaxrmum populations <strong>of</strong> macroalgae may have occurred during the wlnters <strong>of</strong> 1983 and 1984 when tidal flushlng was sluggish and nutrient concentrations were h~gh due to sewage spllls However, our only evidence <strong>of</strong> thts IS the March 1984 air photo, which shows substantial macroalgal growth along the shores <strong>of</strong> the ~nland lagoons and within the northern t~dal creeks After tldal flushlng was reinstated, nelther algal type developed blooms <strong>of</strong> nuisance proport~ons Rudnicki and Fong's joint monitoring program began in 1985 and provided monthly data on the seasonal dynamics <strong>of</strong> channel algae (Figure 50). Three tidal creeks, the dredged channel, and the inland lagoons were sampled for phytoplankton, by 4.3 PRIMARV PRODuC~IV,TY oF CHANNEL collecting water samples to measure chlorophyll ALGAE concentratron and count cells <strong>The</strong> same srtes were sampled srmuitaneously for macroalgae by <strong>The</strong> research <strong>of</strong> Rudnlcki (1986) and Fong determining their cover and maximum biomass. (1986) has characterized temporal patterns <strong>of</strong> algi Macroalgae germinate and develop on the abundance in five habitats at <strong>Tijuana</strong> <strong>Estuary</strong>, and sediments, under shallow water At some later manipulative experiments have shown how algae stage, the algae may be dislodged, float to the respond to different sartnrties and nutr~ent inputs surface, and be moved about by w~nd and water Throughout th~s sect~on. the obS@rv~ttons on currents As a result, cover can be hlghlv var~able macroalgae are based on Rudnicki's work, and rn both space and time, and areas <strong>of</strong> simrlar cover !nforrnation on phytoplankton 1s based on Fong's can ndve very different btomass <strong>The</strong> field survey research, <strong>The</strong> term macroalgae generally refers lo was devised to ident~fy condittons that led to Enteromorpha andlor Ulva, although these genera maximum bromass (called blooms), thus, areas with are not always easy to drstinguish As used here, the greatest volume <strong>of</strong> algae were sampled at each phytoplankton includes aif rnicroscop~c ajgae monrtoring station 60
- Page 1 and 2:
June 1986 I THE ECOLOGY OF TIJUANA
- Page 3 and 4:
The findings in this report are not
- Page 5 and 6:
CONVERSION TABLE Metric to U.S. Cus
- Page 7 and 8:
Page 4.5 Energy Flow ..............
- Page 9 and 10:
Number Page The channel fish cornrn
- Page 11 and 12:
ACKNOWLEDGMENTS The California Sea
- Page 13 and 14:
Figure 1. Lacatlcrn of 71juana Estu
- Page 15 and 16:
Figure 3. Map6 of Tijuana Estuary s
- Page 17 and 18:
FI(I(uPc$ 4. Wei&rahOt@ patt@rns of
- Page 19 and 20: also limitrng Hot, dry desert winds
- Page 21 and 22: 2.3 LAND USE HlSPQWV Through exami!
- Page 23 and 24: The nearby bridge remained, and ext
- Page 25 and 26: flushing until mid-December 1984. E
- Page 27 and 28: with seawater. Even in years with s
- Page 29 and 30: flats ~n winter but not in midsumme
- Page 31 and 32: Each "island" of higher topography
- Page 33 and 34: The vegetation and soils of the upp
- Page 35 and 36: populations (Massey 1979) The brrds
- Page 37 and 38: c~n~entrations of insects, especial
- Page 39 and 40: Frgufe 29. The Ifght-footed clapper
- Page 41 and 42: Figure 30. During winter (above) th
- Page 43 and 44: anlmal footprints, In the hardpan f
- Page 45 and 46: Tijuana Estuary salt marsh Such exp
- Page 47 and 48: Frgura 36 The etraracrel an& tidal
- Page 49 and 50: ^_ _I __"___I _-a_. -- fable 7. Inv
- Page 51 and 52: Pre- 1980 (excluding Hosrner Rehse
- Page 53 and 54: Table 8. Average density (number/m2
- Page 55 and 56: changes in envlronment has not been
- Page 57 and 58: was dominated by goby species, Cali
- Page 59 and 60: compared the ,chthyoplankton commun
- Page 61 and 62: Figure 43, Birds of the intertidal
- Page 63 and 64: -" and that the community was compo
- Page 65 and 66: Willet (1 73) i - Water Depth (cm)
- Page 67 and 68: Table 14. Early information on dune
- Page 69: Figure 48. Birds that nest on the s
- Page 73 and 74: were no? irght-saturated untri expo
- Page 75 and 76: Table 17. Conceptual model of chann
- Page 77 and 78: Table 19. Net aboveground productiv
- Page 79 and 80: _I___ I__-~--- 4.4.1 Nitragen Fluxe
- Page 81 and 82: i i t 1 1 I Table 22. Standing crop
- Page 83 and 84: calculated from chlorophyll a measu
- Page 85 and 86: Dissolved Organic Biomass Carbon De
- Page 87 and 88: CHAPTER 5 THE ROLE OF DISTURBANCES
- Page 89 and 90: Table 25. Changes in elevation in t
- Page 91 and 92: Table 26. Change in pickleweed cano
- Page 93 and 94: Table 27. Occurrence (in circular 0
- Page 95 and 96: perennials can survive long periods
- Page 97 and 98: An experiment was designed to deter
- Page 99 and 100: CHAPTER 6 MANAGEMENT CONSIDERATIONS
- Page 101 and 102: Closely associated with the researc
- Page 103 and 104: c. Dredging at Tijuana Estuary will
- Page 105 and 106: Table 30. Predicted impacts of redu
- Page 107 and 108: footed clapper rails; the picklewee
- Page 109 and 110: overwashas, and slabiiizatran rs rl
- Page 112 and 113: REFERENCES Allen, L.G. 1980. Struct
- Page 114 and 115: Minsky, D. 1984. California least t
- Page 116: 30272 -101 REPORT WUMENTATION 1. RE