

The Ecology of Tijuana Estuary, California: An Estuarine Profile
The Ecology of Tijuana Estuary, California: An Estuarine Profile
The Ecology of Tijuana Estuary, California: An Estuarine Profile

Create successful ePaper yourself
Turn your PDF publications into a flip-book with our unique Google optimized e-Paper software.
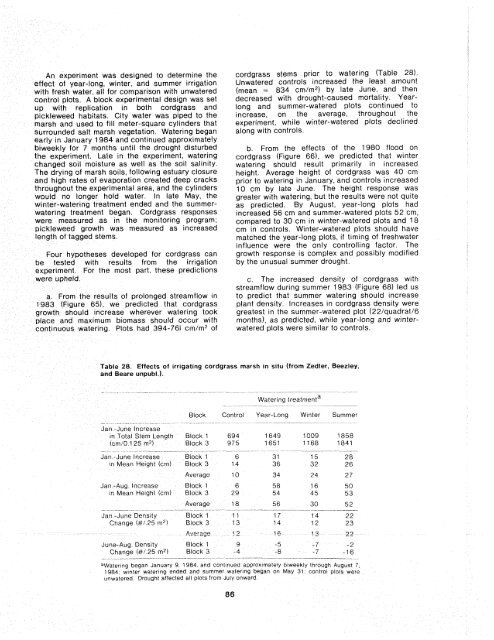
<strong>An</strong> experiment was designed to determine the cordgrass stems prior to waterlng able 28).<br />
effect <strong>of</strong> year-long, winter, and summer irrigation Unwatered controls increased the least amount<br />
with fresh water, all for comparison with unwatered (mean = 834 cm/m2) by late June, and then<br />
control plots. A block experimental design was set decreased with drought-caused mortality. Yearup<br />
with replication in both cordgrass and long and summer-watered plots continued to<br />
pickieweed habitats. City water was piped to the increase, on the average, throughout the<br />
marsh and used to fill meter-square cylinders that experiment, while winter-watered plots declined<br />
surrounded salt marsh vegetation. Watering began along with controls.<br />
early in January 1984 and continued approximately<br />
biweekly for 7 months until the drought disturbed b. From the effects <strong>of</strong> the 1980 flood on<br />
the experiment. Late in the experiment, watering cordgrass (Figure 661, we predicted that wlnter<br />
changed soil moisture as well as the soil salinity. watering should result primarily in increased<br />
<strong>The</strong> drying <strong>of</strong> marsh soils, following estuary closure height. Average height <strong>of</strong> cordgrass was 40 cm<br />
and high rates <strong>of</strong> evaporation created deep cracks prior to watering in January, and controls increased<br />
throughout the experimental area, and the cylinders 10 cm by late June. <strong>The</strong> height response was<br />
would no longer hold water. In late May, the greater with watering, but the results were not quite<br />
winter-watering treatment ended and the summer- as predicted. By August, year-long plots had<br />
watering treatment began. Cordgrass responses increased 56 cm and summer-watered plots 52 cm,<br />
were measured as in the monitoring program; compared to 30 cm in winter-watered plots and 18<br />
pickleweed growth was measured as increased cm in controls. Winter-watered plots should have<br />
length <strong>of</strong> tagged stems.<br />
matched the year-long plots, if tlming <strong>of</strong> freshwater<br />
influence were the only controlling factor. <strong>The</strong><br />
Four hypotheses developed for cordgrass can growth response is complex and possibly modified<br />
be tested with results from the irrigation by the unusual summer drought.<br />
experiment For the most part, these predictions<br />
were upheld,<br />
c, <strong>The</strong> increased de~sity <strong>of</strong> cordgrass wrth<br />
streamflow during summer 1983 (Figure 68) led us<br />
a. From the results <strong>of</strong> prolonged strearnflow in to predict that summer watering should Increase<br />
1983 (Figure 651, we predicted that cordgrass plant density. Increases In cordgrass density were<br />
growth should increase wherever watering took greatest in the summer-watered plot (22/quadrat/6<br />
place and maximum biomass should occur with months), as pred~cted, while year-long and wintercont~nuous<br />
watering. Plots had 394-761 cm/m"f watered plots were similar to controls.<br />
fable 28. Effects <strong>of</strong> irrigating cordgrass marsh in situ (from Zedler, Beezley,<br />
and Beare unpubl.).<br />
. -<br />
Jar~ -June Increase<br />
in Total Stern Length Block 1 694 1649 1009 1858<br />
km!O 125 m2) Block 3 975 1651 1168 1841<br />
-- --- -<br />
Jan -June Increase BIock 1 6 31 15 28<br />
In Mean Height (cml Block 3 14 36 32 26<br />
- --<br />
Average 10 34 2 4 27<br />
Jan -Aug Increase Block 1 6 58 16 50<br />
in Mean Wetght (cm) Block 3 29 54 45 53<br />
-<br />
Average<br />
- - " +<br />
18 56 30<br />
------ -. -<br />
52<br />
"-<br />
Jan -June Density Block 1 11 17 14 22<br />
Change (#I 25 m2) Block 3 13 14 12 23<br />
Average 12 '5 13 2 2<br />
June-Aug Density Block 1 9 - 5 -7 - 2<br />
Change (#I 25 m2) Block 3 - 4 - 8 - 7 -1 6<br />
-- - - - - -- - - --- -- - --" -- - --<br />
"Watering began January 9 1984, and conttnued approximately blweekly through August 7,<br />
1984 winter watering ended and summer watertng began on May 31 control plots were<br />
urlwatered Drought affected all plots trom July onward


